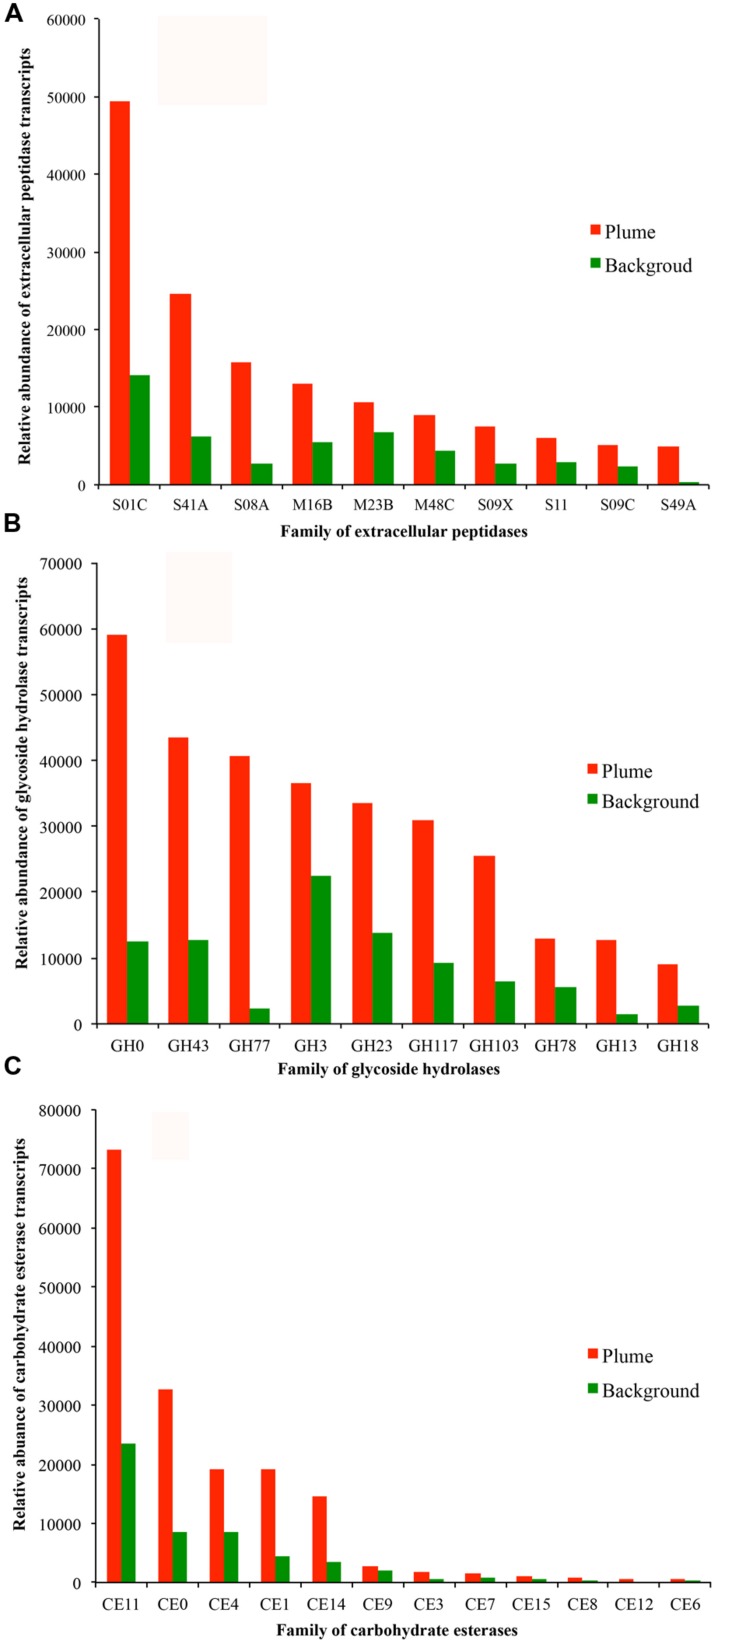
FIGURE 5.
Relative abundance of transcripts at the level of families of extracellular peptidases (A, top 10 families), GHs (B, top 10 families), and CEs (C) identified in the GB plume (red bar) and in the background (green bar). More detailed information is provided in supplementary Figures S2.

