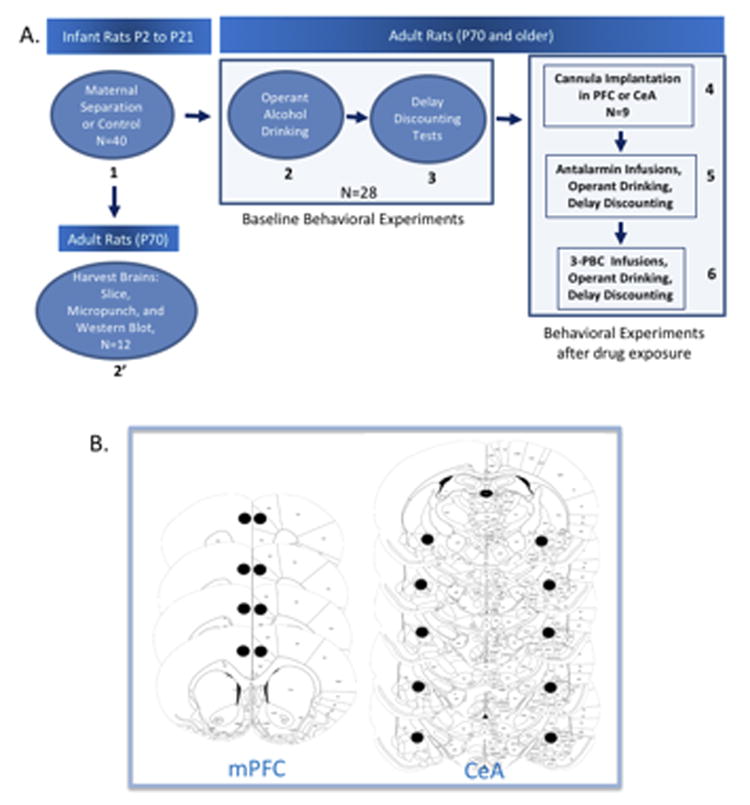
Figure 1. Map of behavioral experiments and locations of cannula implantation for animal studies.

Panel A shows order of experiments demarcated by the numbers in bold and the direction of arrows. Panel B shows the location in the mPFC and the CeA where cannula were implanted. Each slice represents a different animal.
