
FIGURE 2.
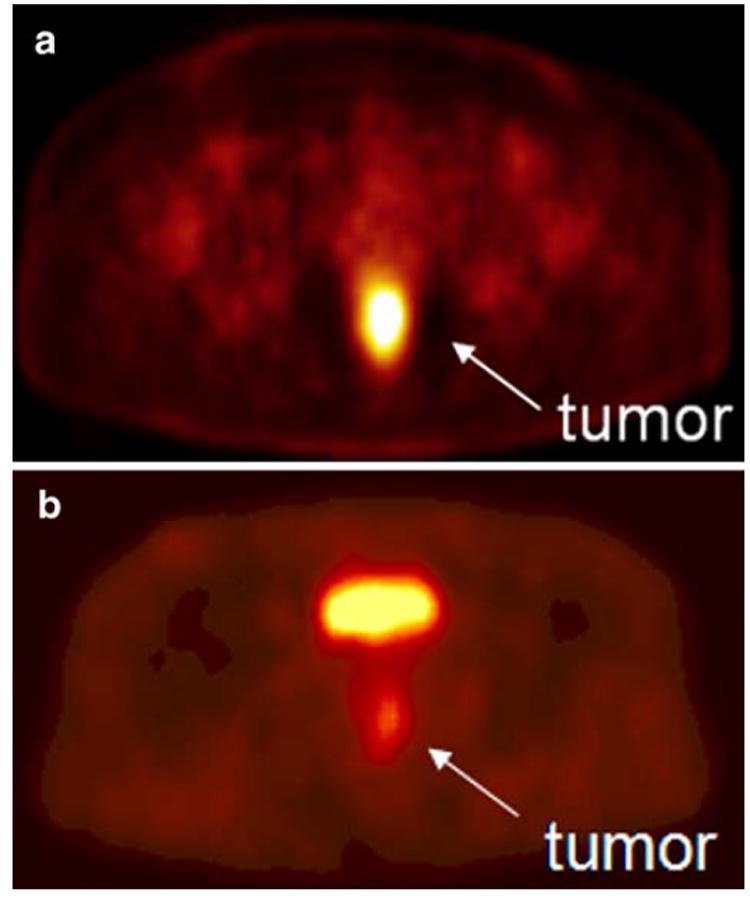
A. 60Cu-ATSM-positron emission tomography scan showing a hypoxic tumor (tumor-to-muscle uptake ratio=3.1). The tumor has increased tracer uptake compared with surrounding tissues because the 60Cu-ATSM is reduced and retained more avidly in hypoxic tissues. This tumor did not respond to neoadjuvant chemoradiation therapy. B. 60Cu-ATSM-positron emission tomography scan showing a normoxic tumor (tumor-to-muscle activity ratio= 2.3). This tumor responded to neoadjuvant chemoradiation therapy. The bright spot above the tumor is the bladder.