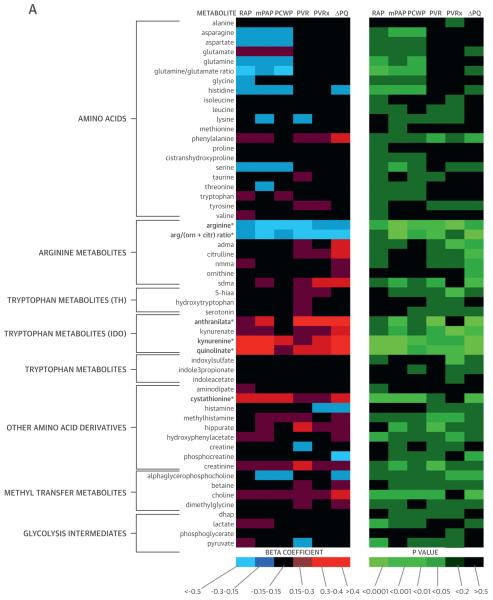
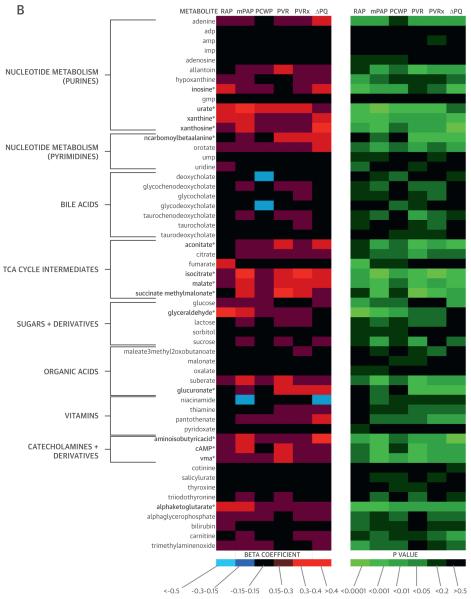
FIGURE 1. Metabolic Heat Map.
β-Coefficients and p values generated from regression analyses depict the relationship of each metabolite (log transformed) with hemodynamic measurements. *p < 0.0095 for associations with 2 or more measurements of RV-PV dysfunction (see Methods). 5-hiaa = 5-hydroxy-indoleacetic acid; ADMA = asymmetric dimethylarginine; adp = adenosine diphosphate; amp = adenosine monophosphate; arg/(orn + citr) = ratio of arginine to sum of ornithine + citrulline; cAMP = cyclic adenosine monophosphate; ΔPQ = change in pressure relative to change in cardiac output during exercise; dhap = dihydroxyacetone phosphate; gmp = guanosine monophosphate; IDO = indoleamine 2,3-dioxygenase; imp = inosine monophosphate; mPAP = mean pulmonary arterial pressure; PAWP = pulmonary arterial wedge pressure; PCWP = pulmonary capillary wedge pressure; PVR = pulmonary vascular resistance; PVRx = pulmonary vascular resistance during exercise; RAP = right atrial pressure; SDMA = symmetric dimethylarginine; TCA = tricarboxylic acid; TH = tryptophan hydroxylase; ump = uridine monophosphate; vma = vanillylmandelic acid.


