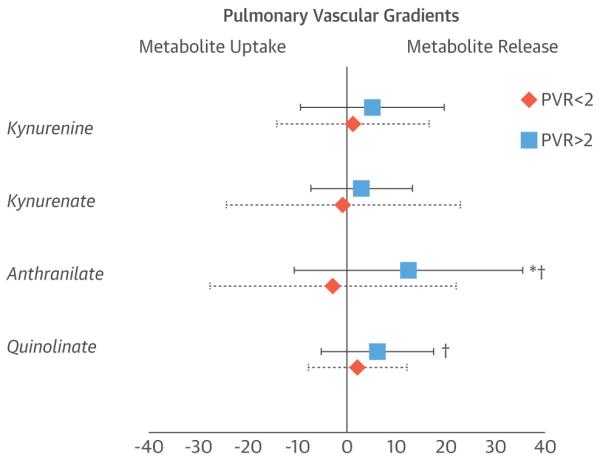
FIGURE 3. Transpulmonary Metabolite Release.

For gradients of indoleamine 2,3-dioxygenase tryptophan metabolites across the pulmonary circulation, the average ± SD percent difference in metabolite levels in the radial arterial samples, compared with the pulmonary arterial samples, is indicated for subjects with pulmonary vascular resistance (PVR) ≤2 Wood units (diamonds) and >2 Wood units (squares). *p < 0.05 for PVR ≤2 Wood units versus PVR >2 Wood units; †p < 0.05 for PVR >2 Wood units versus no difference.
