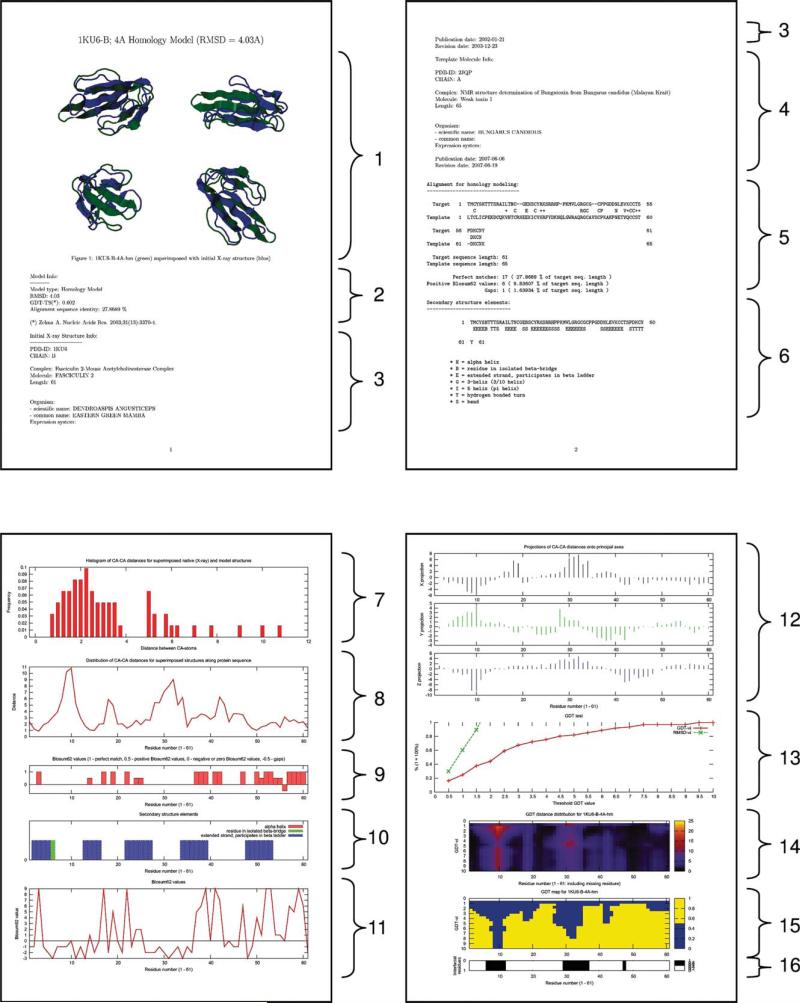
Figure 6.
Information on the complex from the accompanying downloadable file. The 4 Å homology model of 1ku6, Chain B, is characterized by: (1) images of the superimposed native X-ray and modeled structures; (2) information on the model type (HM or NEB), RMSD and GDT_TS values; data on the initial X-ray structure (3) and the template (4) used in homology modeling, both retrieved from PDB; (5) target/template sequence alignment; (6) secondary structure elements in the model structure as defined by DSSP (in Sections 4–6, PDF files for NEB models contain information on both proteins, which were used as start and end points of the low-energy path); (7) histogram of Cα–Cα distances for superimposed native (X-ray) and modeled structures; (8) distribution of Cα–Cα distances for superimposed structures along the protein sequence; (9 and 11) BLOSUM62 values for the amino acid sequence of the model from the alignment (5) (Sections 9 and 11 are provided for HM models only); (10) graphical representation of the secondary structure elements distribution (6) along the protein sequence; (12) distribution of Cα–Cα distances for superimposed native and model structures along the protein sequence (8) in projections onto the principal axes of the molecule; (13–15) visual representation of the GDT_TS test results; and (16) location of the interface residues within the protein sequence.

