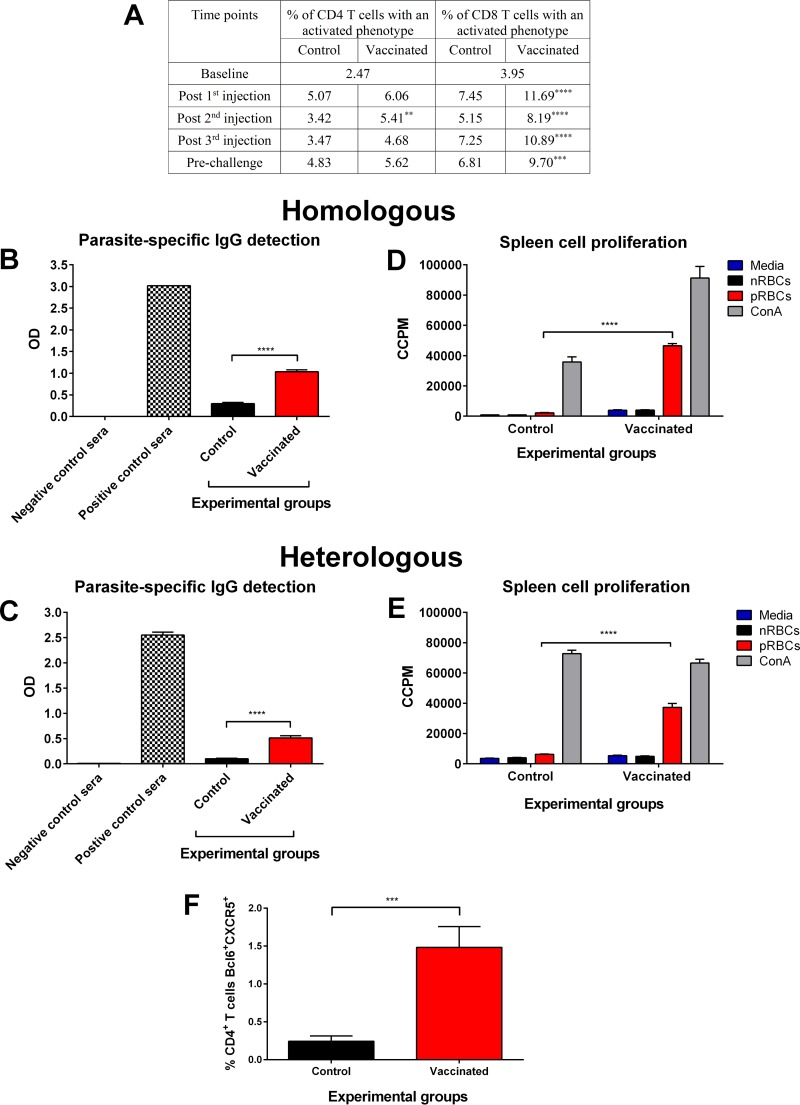
FIG 1.
Induction of immune responses after vaccination with chemically attenuated P. yoelii 17X pRBCs. (A) Vaccine-induced activation of circulating CD4+ and CD8+ T cells. CD49dhi CD11ahi markers were used to identify activated CD4+ T cells, and CD8lo CD11ahi markers were used to identify activated CD8+ T cells in the blood of vaccinated and control mice 7 days after each injection. Data represent the mean results from 20 BALB/c mice per group. Baseline data represent mice from both groups prior to injection. (B and C) Induction of IgG to P. yoelii 17X (B) or P. yoelii YM (C) antigens after three doses of 106 chemically treated P. yoelii 17X pRBCs or nRBCs. IgG was measured immediately prior to challenge using sera diluted 1 in 20, and each sample was tested in duplicate. Sera from naive mice and P. yoelii 17X or P. yoelii YM infection-drug-cured mice were included as negative and positive controls, respectively. Results are represented as the optical density (OD) at 450 nm. Each group contained 10 BALB/c mice, and error bars represent the standard errors of the mean (SEM) for each group. (D and E) Induction of splenocyte proliferation to fresh P. yoelii 17X pRBCs (D) or P. yoelii YM pRBCs (E) after three doses of 106 chemically treated P. yoelii 17X pRBCs or nRBCs. Proliferation was evaluated by incorporation of [3H]thymidine and measured as corrected counts per minute (CCPM). Each group contained three BALB/c mice, and error bars represent the SEM for each group. (F) Induction of CD4+ Tfh cells after vaccination. The percentage of CD4+ T cells expressing Tfh markers (Bcl6 and CXCR5) was assessed in the spleens of vaccinated and control mice 2 days after the third dose. Each group contained 10 BALB/c mice, and error bars represent the SEM for each group. **, P = 0.0028; ***, P < 0.001; ****, P < 0.0001. An unpaired, two-tailed t test was used to compare two experimental groups. For experiments comparing more than two groups, a one-way ANOVA was used, followed by Tukey's multiple-comparison tests.

