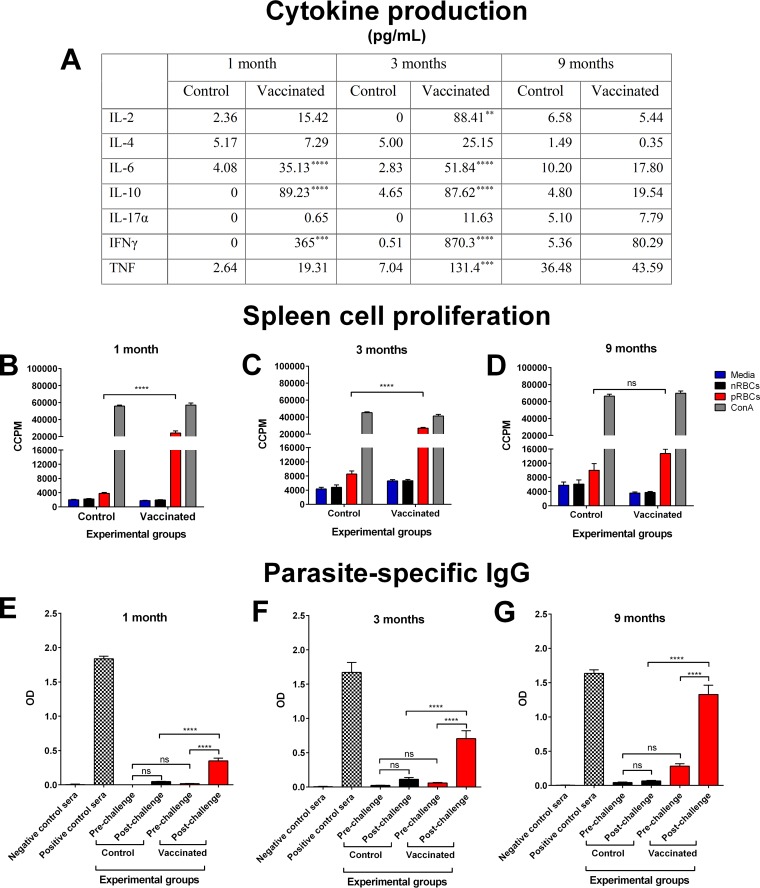
FIG 6.
Vaccine-induced immune responses at 1, 3, and 9 months after completion of the vaccination regimen with chemically attenuated parasites. (A) Production of cytokines by splenocytes in response to homologous live pRBCs at 1, 3, and 9 months after completion of the three-dose vaccination regimen with 106 chemically treated P. yoelii 17X pRBCs (vaccinated) or nRBCs (control). Culture supernatants from splenocyte proliferation assays were collected after 54 h and used in cytokine bead arrays to quantify the level of cytokines produced. The supernatant was pooled from triplicate wells for each mouse, and error bars represent the SEM for each group. Each group contained eight BALB/c mice. **, P = 0.0048; ***, P ≤ 0.0008; ****, P < 0.0001. (B to D) The proliferation of splenocytes from control and vaccinated BALB/c mice in response to fresh P. yoelii 17X pRBCs was assessed at 1 month (B), 3 months (C), or 9 months (D) after the final dose. The proliferation was estimated by the incorporation of [3H]thymidine and measured as corrected counts per minute (CCPM). Splenocytes from each mouse were tested in triplicate. Each group contained eight mice, and error bars represent the SEM for each group. ns, not significant. (E to G) Assessing parasite-specific memory B cell responses at 1 month (E), 3 months (F), and 9 months (G) after completion of the three-dose vaccination regimen. The production of IgG against crude P. yoelii 17X antigens was measured in the pre- and postchallenge sera of control and vaccinated BALB/c mice. Sera were titrated using 3-fold dilutions from a 1 in 50 dilution to a 1 in 109,350 dilution, with the 1 in 1,350 dilution shown as a representation of the data. Samples were tested in duplicate for each mouse. Sera from naive mice and infection-drug-cured mice were included as negative and positive controls, respectively. The results are expressed as the optical density (OD) at 450 nm. Each group contained ten mice, and error bars represent the SEM for each group. Data were analyzed using a one-way ANOVA, followed by Tukey's multiple-comparison tests.

