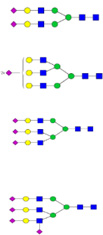
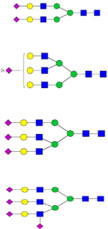
Table 1.
Glycosylation Sites and Glycan Composition Identified from Mixed Samples of fetuin, AGP, and PTG. Symbols:  , N-acetylglucosamine;
  , mannose;
  galactose;
  , fucose;
  , N-acetylneuraminic acid.
| Protein | Peptide Backbone Sequence | Glycan Composition |
|---|---|---|
| Fetuin | LCPDCPLLAPLNDSR |  |
| RPTGEVYDIEIDTLETTCHVLDPTPLANCSVR |  |
|
| AGP | LVPVPITNATLDQITGK | |
| QDQCIYNTTYLNVQR | ||
| PTG | FLANVGQFNLSGALGTR |  |
| LGVNVTWTLR |  |
|
| QVPATSNTSQDPLGCVR | ||
| LCDVDPCCTGFGFLNVSQLK |
