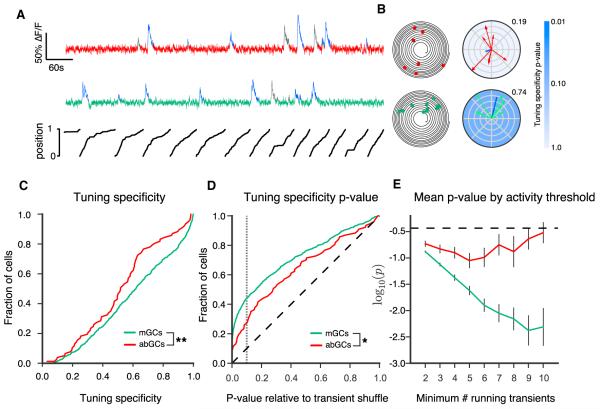
Figure 2. Spatial Tuning of abGCs and mGCs.
(A) Time series of calcium signals from an example abGC (red) and mGC (green), with position of the mouse along the circular treadmill belt plotted below. Running-related calcium transients are indicated in blue (all others in gray).
(B) Left: trajectory plot of position (angular coordinate) and time (radial coordinate) with running-related calcium transients as dots along the trajectory. Right: spatial tuning plots for example mGC (green) and abGC (red). Vectors indicate the animal’s position at the time of each running-related transient onset, with magnitude determined by the inverse of the fraction of time spent at that position. Blue lines indicate the calculated tuning vectors, whose orientation and magnitude correspond to the tuning direction and specificity, respectively. Tuning specificity is given next to each plot. Tuning specificity p value is indicated by blue shading.
(C) Cumulative distributions of tuning specificity values for active mGCs and abGCs (≥ four running-related transients). The abGC distribution was significantly left shifted as compared to the mGC distribution with few sharply tuned cells (p < 0.01; n = 639 mGCs, 77 abGCs from 11 FOVs in 6 mice; two-sample KS Test, KS Stat = 0.217, p < 0.01).
(D) Cumulative distributions of tuning specificity p values. The p value distributions for mGCs and abGCs differed significantly from each other (p < 0.05; KS test, KS Stat = 0.18) and from the uniform distribution (diagonal dashed line) expected in the case of a nonspatially tuned population (p < 0.001 for both mGCs and abGCs; KS test, abGCs, KS Stat = 0.25, mGCs KS Stat = 0.35). Gray dashed line indicates p = 0.1.
(E) Mean logarithm of the p value for mGCs and abGCs with differing inclusion thresholds for the number of running-related calcium transients. For mGCs, the p values monotonically decrease with increasing inclusion threshold, consistent with the increased statistical power provided by a greater numbers of transients. The lack of such a decrease in the adult-born population suggests that the more active abGCs tend to be less tuned or consist of a mixed population of tuned and untuned cells. The dashed black line shows the expected value for an untuned population.
Error bars are mean ± SEM.

