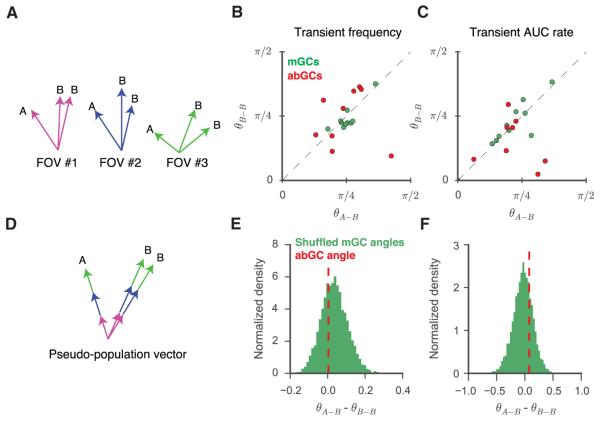
Figure 5. Mean Activity in GCs Does Not Code for Context.
(A) Schematic of population vector analysis. Activity-based vectors were defined for each experiment, and angles were measured between sequential exposures to the same (θB-B) or similar (θA-B) contexts.
(B and C) Scatter of population vector angles across the two conditions in which vector components are defined as transient frequency (B) or rate of transient AUC (area under the curve of significant Ca2+ transients divided by the total time) (C). Each point corresponds to mature (green) or newborn (red) cells from one FOV. For neither abGC (B; paired t test, T(16) = 0.04, p = 0.97; C; T(16) = 1.25, p = 0.25) nor mGC (B; T(18) = 1.53, p = 0.16; C; T(18) = 0.32, p = 0.76) populations were the vectors more similar for sequential exposures to the same context than for sequential exposures to different contexts.
(D) For each contextual exposure, we calculated a single pseudopopulation vector by concatenating the newborn population vectors from all FOVs. Schematic is drawn to illustrate the case of activity-based discrimination.
(E and F) Lack of evidence for activity-based discrimination (θA-B – θB-B) for either transient frequency (E) and transient AUC rate (F). The dotted red line indicates the difference in the angles between the abGC pseudopopulation vectors. The difference was consistent with the distribution (green histogram) of such differences attained by repeatedly randomly downsampling similarly constructed pseudopopulations of mature cells (E, percentile = 34; F, percentile = 73; see Experimental Procedures).

