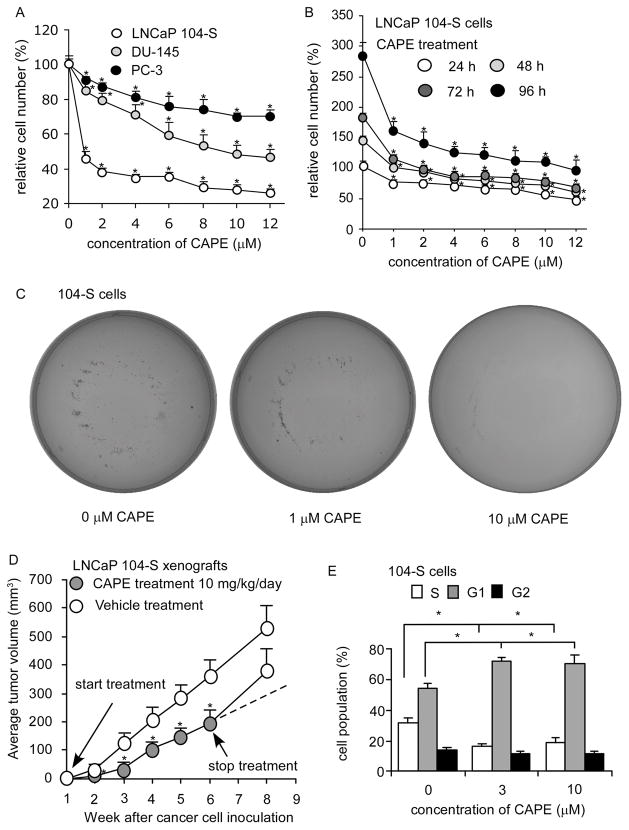
Figure 1. CAPE suppressed proliferation of prostate cancer cells in vitro and in vivo.
(A) LNCaP, PC-3, and DU-145 cells were treated with increasing concentrations of CAPE for 96 h to determine suppressive effect of CAPE on prostate cancer cell lines. (B) LNCaP 104-S cells were treated with increasing concentrations of CAPE for 24, 48, 72, 96 h to investigate the suppressive effects of CAPE. Relative cell number was normalized to cell number of control (no treatment) at 24 h. (*) represented that cell number difference was statistically significant (p < 0.05) compared to that of control (no treatment) at the same time period. (C) Anticancer effect of CAPE was determined by a colony formation assay of LNCaP 104-S cells treated with 0, 1, 10 μM for 14 days. Image is representative of three biological replicates. (D) LNCaP 104-S cells were injected subcutaneously into athymic mice to form tumors. CAPE (10 mg/kg/day in sesame oil) or vehicle (sesame oil) was administered by gavage starting one week after cancer cell injection. Tumor volume of mice carrying 104-S xenografts was measured weekly. CAPE and vehicle treatment were stopped at 6th week and tumors were allowed to grow for another two weeks. Dashed line represents expected tumor growth if CAPE treatment continued. Tumor volume was shown as volume plus standard error (SE). (E) LNCaP 104-S cells were treated with CAPE for 96 h, harvested, and stained with propidium iodide dye for flow cytometric analysis of cell cycle distribution. (*) represents statistically significant difference (p < 0.05) between the two group of cells being compared.

