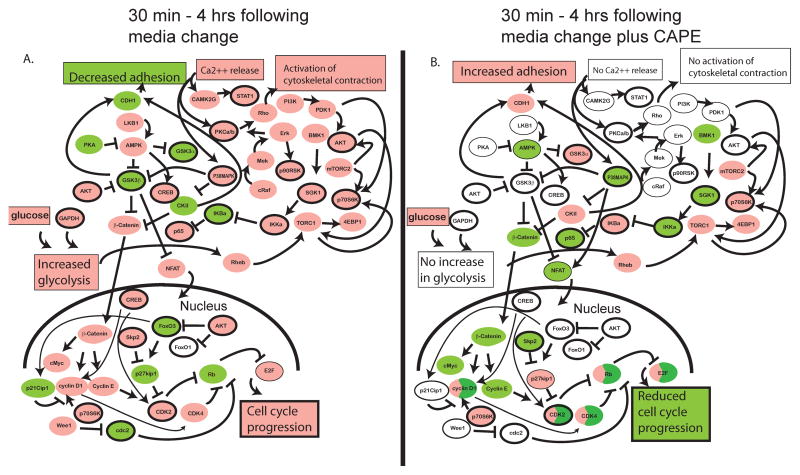
Figure 4. Putative model of CAPE describing the cause-effect relationship of the activity of 19 measured and 27 inferred proteins in LNCaP 104-S cells following addition of fresh serum-containing growth medium in the absence (A) or presence (B) of 10 μM CAPE in the time between 0 minutes and 4 hours.
Protein nodes measured in the Micro-Western Array experiment were arranged in the figure along with unmeasured protein nodes based on relationships suggested from the literature. Nodes with measured or inferred up-regulation in activity are colored pink. Those with a measured or inferred down-regulation in activity are colored green. Those with no measured or inferred change are colored white. Those proteins downstream of opposing influences are colored half green and half pink. Measured nodes have a deep black outline while inferred (unmeasured) nodes have no black outline (in the case of colored nodes) or a thin black outline (in the case of non-colored nodes). Protein nodes are depicted in small ovals while cellular behaviors are depicted in large boxes.

