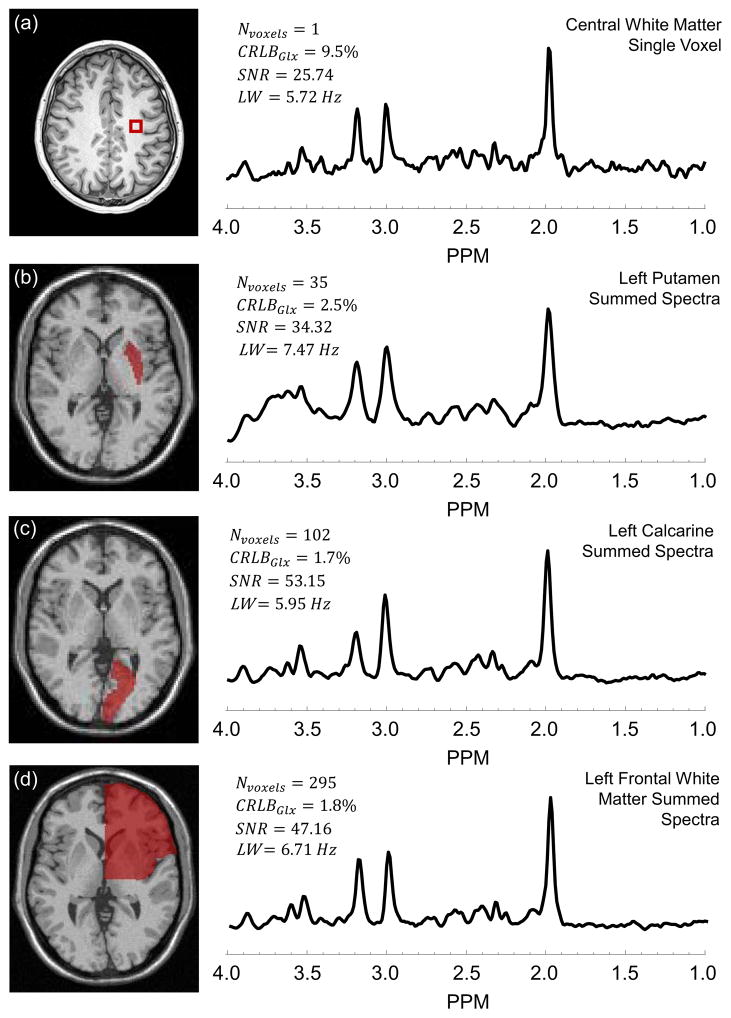
Figure 1.
Example spectrum for a single voxel in the central white-matter (a) and summed spectra for the left putamen (b), left calcarine (c), and left frontal white-matter (d). With each spectrum is given the corresponding number of voxels summed (NVoxels), Cramer-Rao bounds of fitting of Glx (CRLBGlx), linewidth (LW), and signal-to-noise ratio (SNR). The corresponding regions are indicated on the MRI shown to the left of each spectrum.

