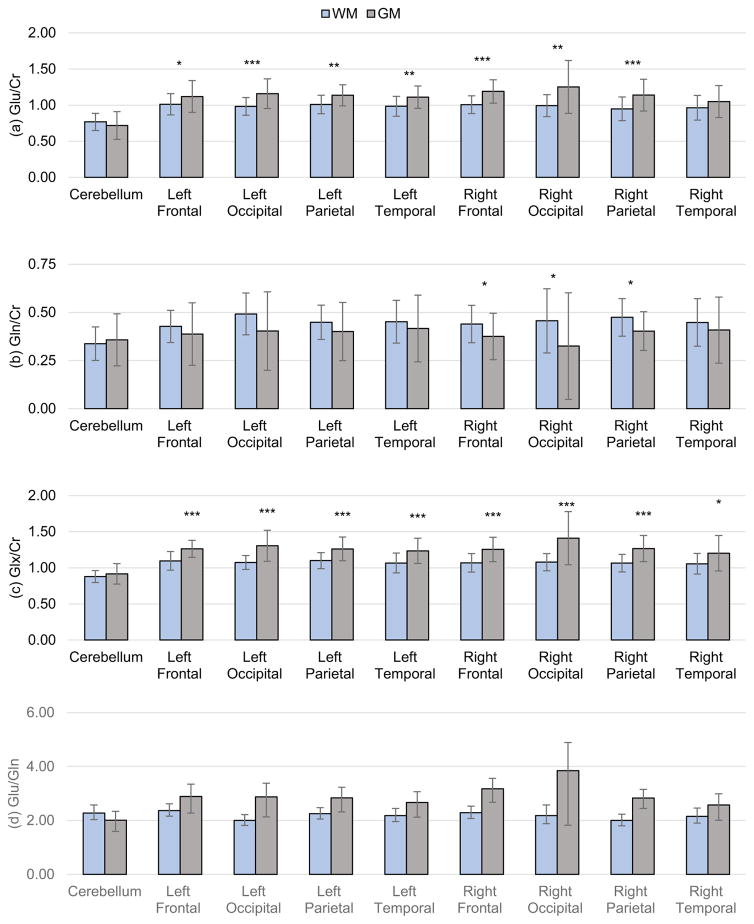
Figure 3.
Mean lobar Glu/Cr (a), Gln/Cr (b), and Glx/Cr (c) measurements for gray- and white-matter regions with error bars denoting standard deviation in measurements. Significance of difference between gray- and white-matter ratios are shown by asterisks (* p<0.05, ** p < 0.01, *** p<0.001). (d) Glu/Gln ratio for gray- and white-matter lobar brain regions with error bars denoting confidence interval (CI) calculated using the Fieller method.

