
Figure 2.
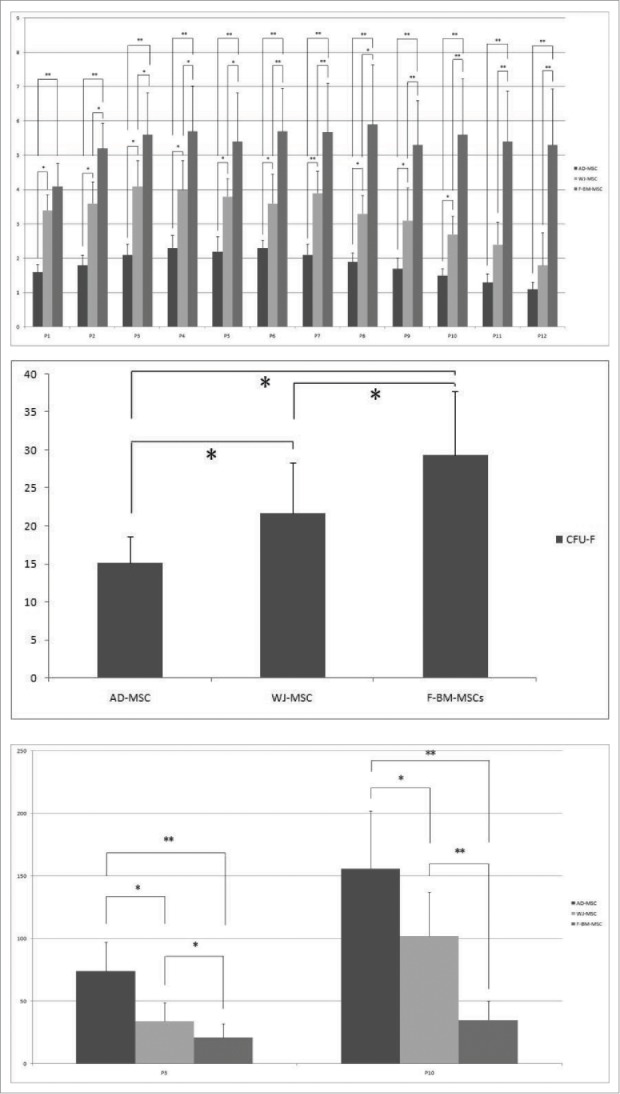
Growth kinetics ofF- BM-, AT-, and WJ-MSCs. (A) F-BM-MSCs and WJ-MSC showed more population-doubling (PD) than AD-MSC in all passages; (B) Clonogenetic capacity was measured by colony forming unit-fibroblast (CFU-F) assay. F-BM-MSCs formed more colonies than WJ- or AT-MSCs in Passage 3; (C) Each population doubling time (PDT) was analyzed in Passage 3 to 4 and in Passage 10 to 11, respectively. In both passages, the PDT of F-BM-MSCs was significantly lower. Error bars represent the means ± SD, n = 5; ** P < 0.01; P, passage.