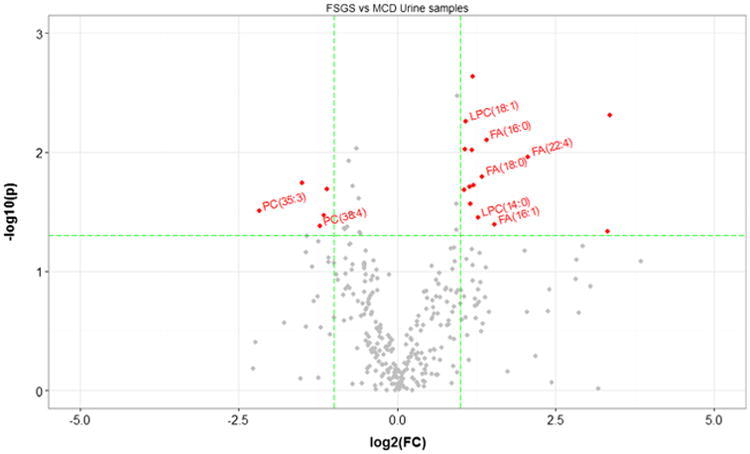
Fig. 1.

Comparisons between focal segmental glomerulosclerosis (FSGS) and minimal-change disease (MCD) patient samples. Comparisons of all metabolites from urine of patients with FSGS (n=8) or MCD (n=10). The y axis is the negative log10 of p values (a higher value indicates greater significance), and the xaxis is the difference in signal intensity between two experimental groups as measured in log2 space. The volcano plot displays the relationship between fold change and significance between the two studied groups. Metabolites significantly differentiated are color coded, and important ones are labeled (p value<0.05, fold change>2).
