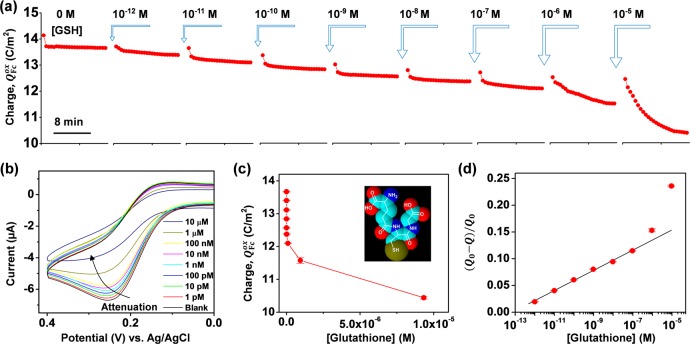
Figure 7.
Quantitative analysis of GSH signal attenuation. (a) Progressive attenuation of Fc oxidation with addition of increasing GSH concentrations. (b) CV representations show attenuation of Fc oxidation. (Input–output curves for this experiment are provided in Figure S3 in Supporting Information.) (c) Fc oxidative charge transfer (average of the last five cycles) for each GSH concentration. (d) Normalized signal attenuation is linear over 5 orders of magnitude in GSH concentration.

