
Figure 1.
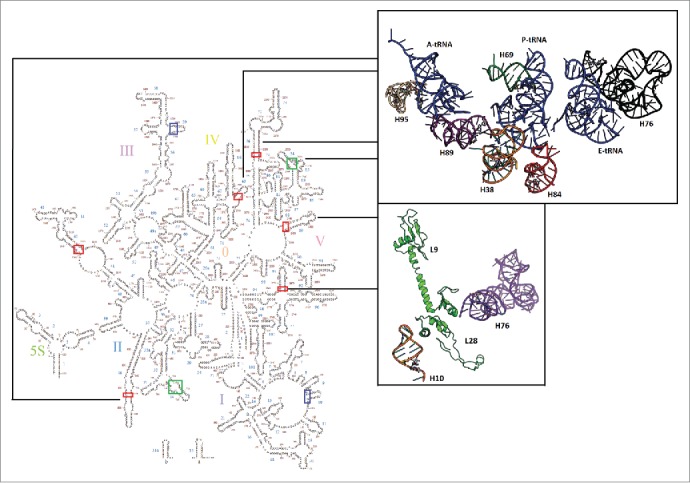
Large subunit map with pivoting positions highlighted. Mobile pivots are highlighted: EF-Tu alone (blue), EF-G alone (green), both (red). The upper structural insert shows a selection of pivoting helices proximal to the tRNA as it moves toward the exit site. The lower insert shows H10 (orange) positioned to interact with proteins bL9 and bL28, which in turn contact the highly mobile H76/ uL1 stalk.