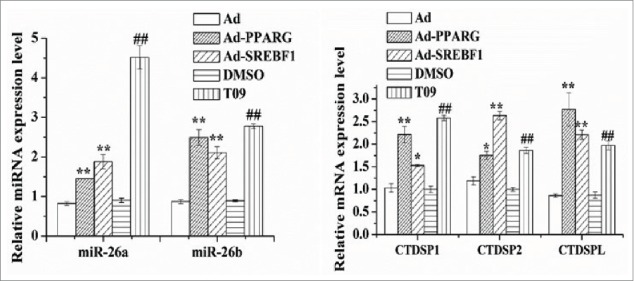
Figure 2.

Induction of miR-26a/b and host genes expression by transcription factors. Cells were treated with Ad-PPARG/Ad-SREBF1 and T0901317 (T09), and then the miR-26a/b and their host genes expression levels was quantified by quantitative real-time PCR. Each treatment was carried out in triplicate and repeated 3 times (n = 9). Values are presented as mean ± SEM; *P < 0.05, **P < 0.01 vs Ad, #P < 0.05, ##P < 0.01 vs DMSO.
