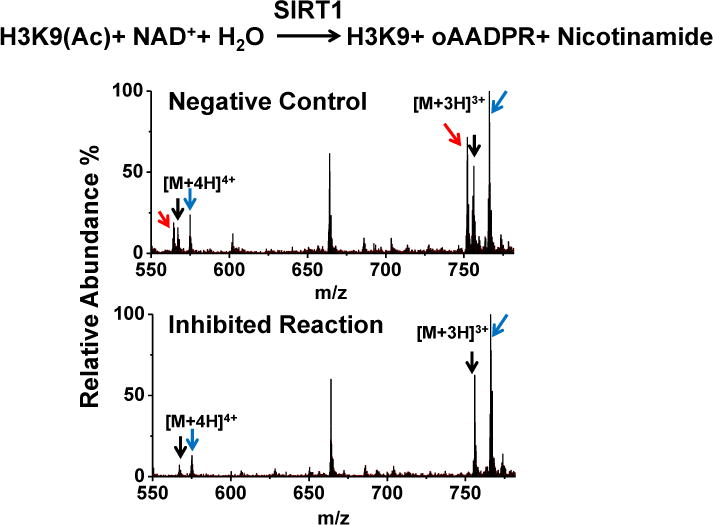
Fig. 2.

Deacetylation of H3K9(Ac) by SIRT1. The reaction is shown on the top (NAD+ stands for nicotinamide adenine dinucleotide; oAADPR stands for O-acetyl-ADP-ribose). The mass spectra are from a reaction without any modulator (negative control) and a reaction with an inhibitor. Triply charged and quadruply charged H3K9 (red arrow), H3K9* (black arrow) and H3K9(Ac) (blue arrow) are monitored. Intensity ratio of H3K9 (m/z 564.4 + m/z 752.6)/H3K9* (m/z 567.3 + m/z 756.1) is calculated for quantification.
