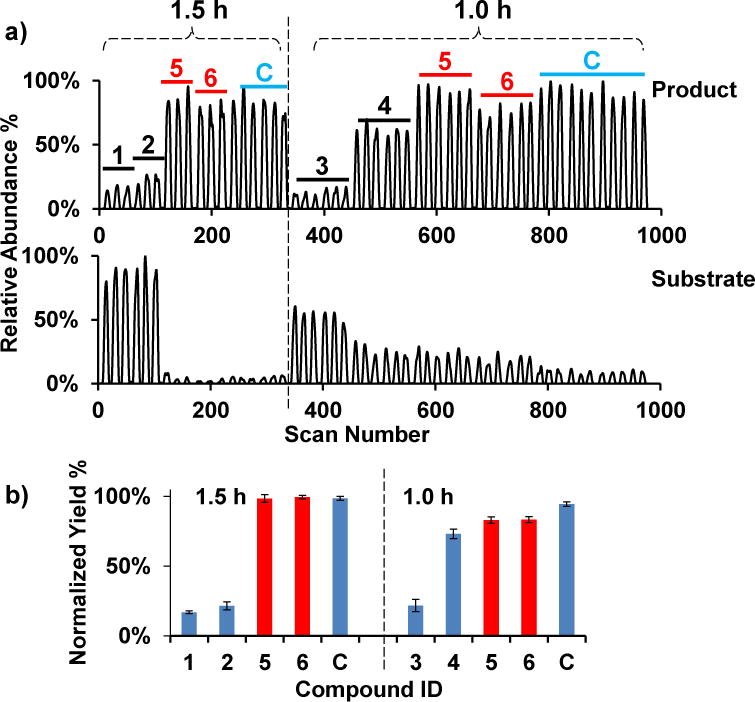
Fig 7.

a) Droplet traces the product (top) and the substrate (bottom) of SIRT1 assay in 1.5 h (left, ≥3 droplets each) and 1.0 h (right, ≥6 droplets each) reactions. Droplet signals for 1, 2, 3, 4, 5, and 6 are EX-527, suramin, C646, nicotinamide, resveratrol, and piceatannol respectively. C is the DMSO control. The reaction mixtures were cleaned up by C18 solid phase extraction columns prior to reformatting into droplets. b) Data from a) are reported as the ratio of peak height of the product against the sum of product and substrate, and then normalized to the yield of control reactions at 1.5 h (n ≥ 3). The bars are labeled with the same numbers and letters as a). The red bars are resveratrol and piceatannol reactions.
