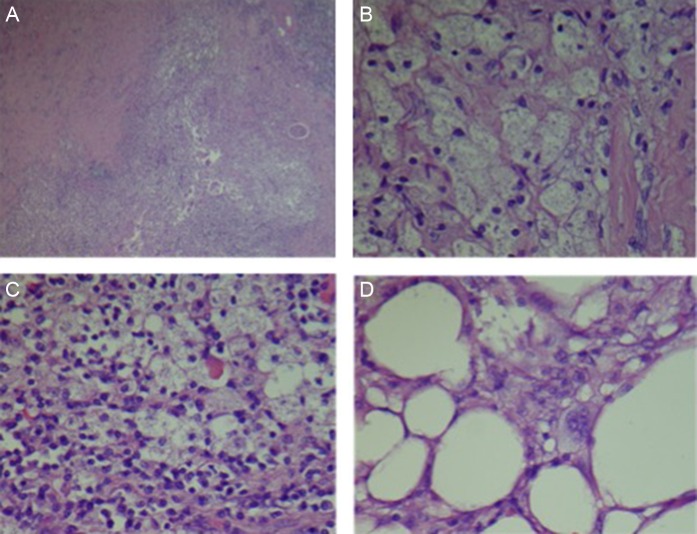
Figure 4:
(A) Low poor view of altered, atrophic and sclerosed renal parenchyma with histiocytic localized inflammation. (B) High power view of foamy histiocytes (xanthomatous cells). (C) Mixed xanthomatous and chronic inflammatory infiltrate. (D) Xanthomatous infiltration of perinephric adipose tissue.

