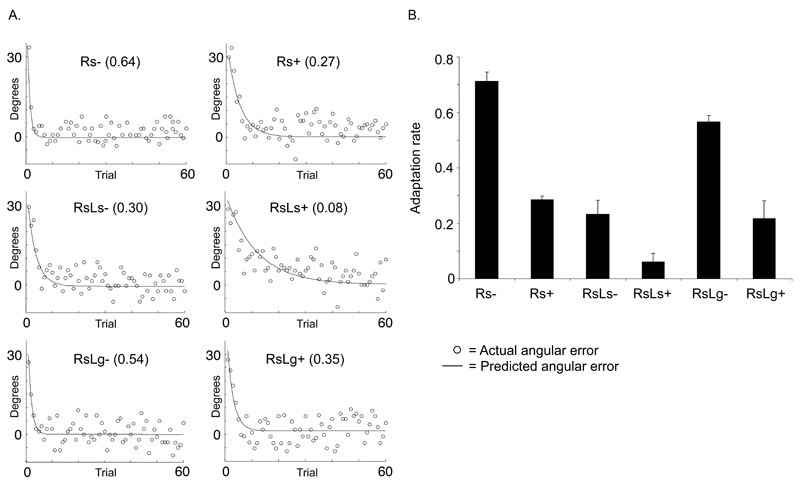
Fig.3. Experiment one: step adaptation.
A = Sample participant angle data for each group (circles) and the predicted curves from the applied state-space model (Eq. 1/2; black stars). The black line represents the angular displacement. Numbers in brackets indicate the rate of adaptation. B = Group averages for the rate of adaptation (A Eq 1.2) derived from the state-space model (mean±SEM).

