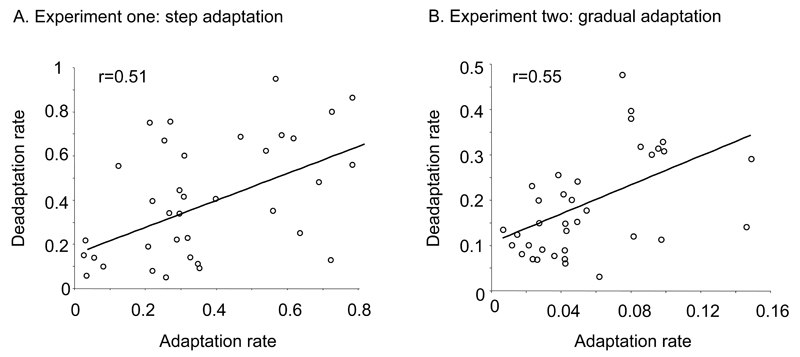
Fig.5. Comparison of adaptation and deadaptation rate.
A = A positive correlation was found between the adaptation and deadaptation rate (r=0.51) across all groups within experiment one. It is important to note that a slower deadaptation rate suggests better retention. B = A similar positive correlation (r=0.55) was observed across all groups within experiment two. Note the change in the y-axis and x-axis scale across figures, which shows that gradual adaptation generally adapted slower (smaller adaptation rate) and retained the information for longer (smaller deadaptation rate).

