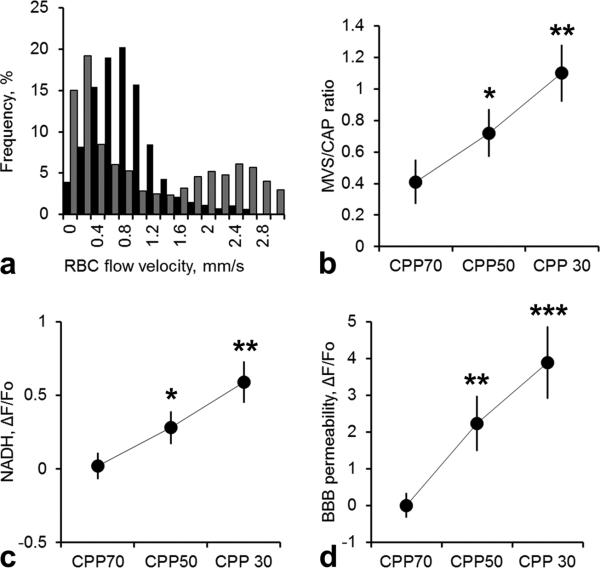
Figure 1.
a) Normalized frequency histograms showing normal microvascular red blood cell flow (RBC) velocity distribution at CPP of 70 mmHg (■) and at CPP of 30 mmHg (■). Decrease of CPP by increasing ICP resulted in redistribution of microvascular flow: capillary flow became very slow while higher flow velocity microvascular shunt flow appeared suggesting a shift from capillaries to higher flow velocity and larger MVS. The vertical dashed line demarcates a velocity of 1.0mm/sec. b) Changes in microvascular shunt/capillary flow (MVS/CAP) ratio showing that decrease of CPP by increasing ICP resulted in the transition to MVS flow. c) Graph shows progression of tissue hypoxia reflected by NADH autofluorescence increase during reduction of CPP by ICP elevation. Data a presented as ΔF/Fo, where Fo is NADH at CPP = 70 mmHg. d) Graph illustrates the average of tetramethylrhodamine fluorescence in brain tissue (extravasation) reflecting progression of BBB degradation during reduction of CPP by ICP elevation. Data a presented as ΔF/Fo, where Fo is fluorescence at CPP = 70 mmHg. All data are presented as Mean±SEM, n=10,*=p<0.05, **=p<0.01, ***=p<0.01.

