
Figure 2.
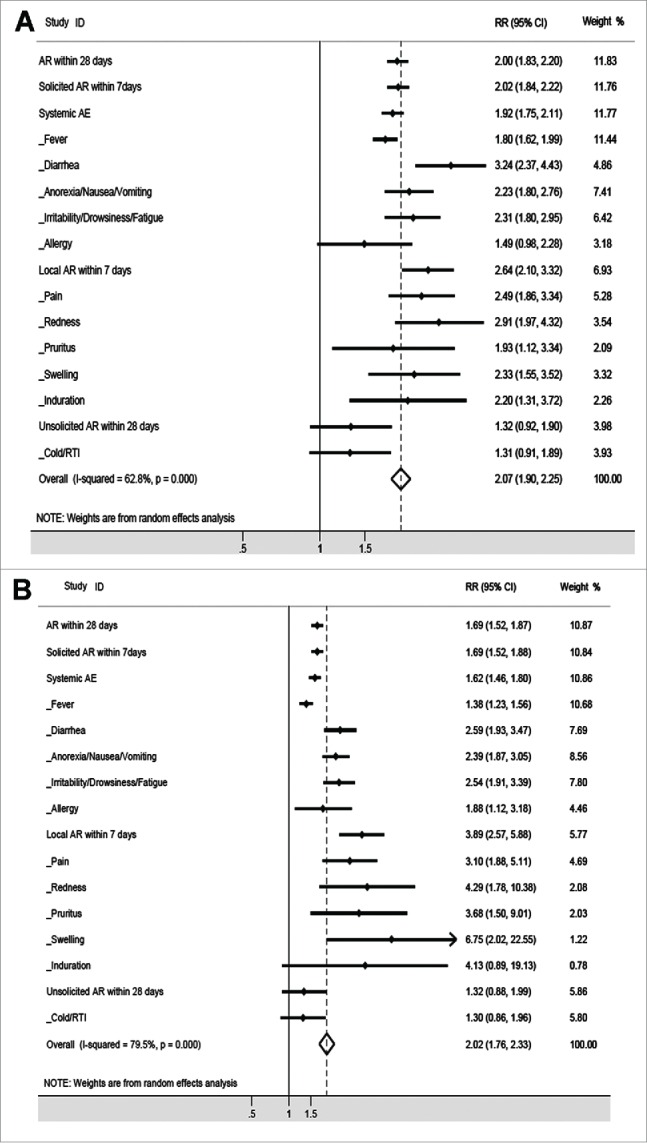
Comparison of the 2 safety sets in the vaccine group or in the placebo group. The rate of adverse reactions in the first safety analysis population was compared to the rate of adverse reactions in the second safety analysis population in the vaccine group (A) and placebo group (B).