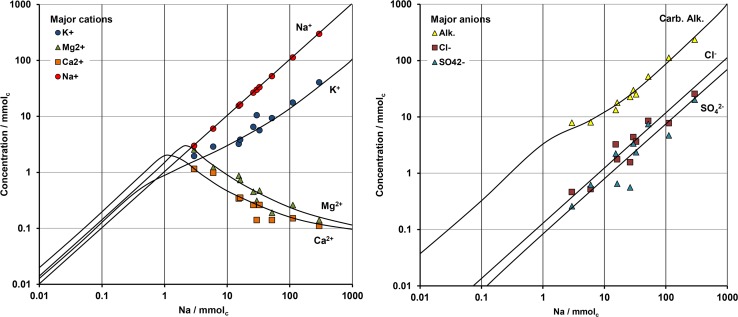
Fig 2. Concentration diagrams based on Na contents showing the regional trends (solid line) compiled from Furian et al. [32] and the chemistry of waters collected in auger holes along the transect of Salina Verde.
Note the sigmoidal shape of dissolved K along the concentration process.

