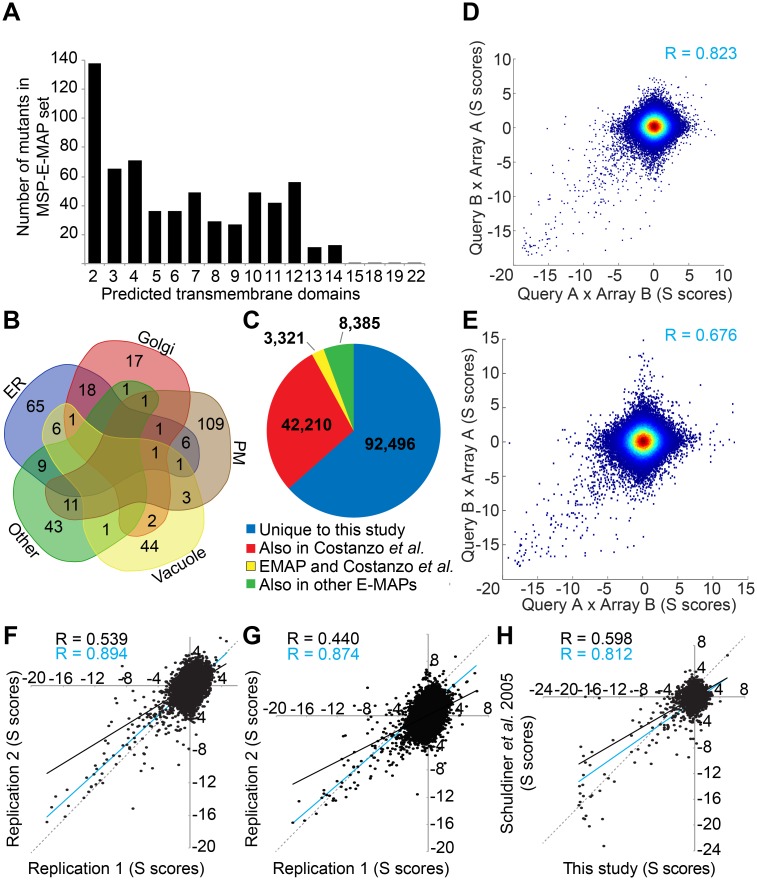
Fig 1. Membrane spanning protein E-MAP.
(A) number of predicted TMDs in the proteins of the E-MAP gene set. (B) using manually curated annotations of YeastMine (http://yeastmine.yeastgenome.org/) most genes of the E-MAP set were attributed to one of 4 different subcellular locations (S1 Table). A few genes are described as being in two or three locations. PM = plasma membrane. (C) overlap of gene combinations tested in our MSP-E-MAP, the E-MAPs form the Krogan lab (http://interactome-cmp.ucsf.edu/) and systematic genetic array (SGA) studies of the Boone lab (http://drygin.ccbr.utoronto.ca/). (D, E) comparison of unaveraged genetic interaction scores (S scores) obtained in reciprocal crosses of [query A x array B] and [query B x array A] for all double mutants in the MSP-E-MAP (D) and MSP/C-E-MAP (E) after removal of noisy strains (see materials and methods). Correlation coefficients of significant S scores are indicated in blue. (F, G) a subset of 84 randomly chosen queries were crossed anew with the 629 genes of the array selecting without (F) or with Cerulenin (G). The experiment (= replicate 2) was done by authors Christine Vionnet and Carole Roubaty and the S scores plotted against those obtained in the first E-MAP experiment done by author Hector Vazquez (= replicate 1). Trend-lines and the corresponding Pearson correlation values of all dots (black) or only those having a statistically significant S score (blue). The dotted lines represent the theoretical correlation of R = 1. H, comparison of the S scores of double mutants of our MSP-E-MAP with the corresponding S scores obtained by [28] in their ESP-E-MAP.

