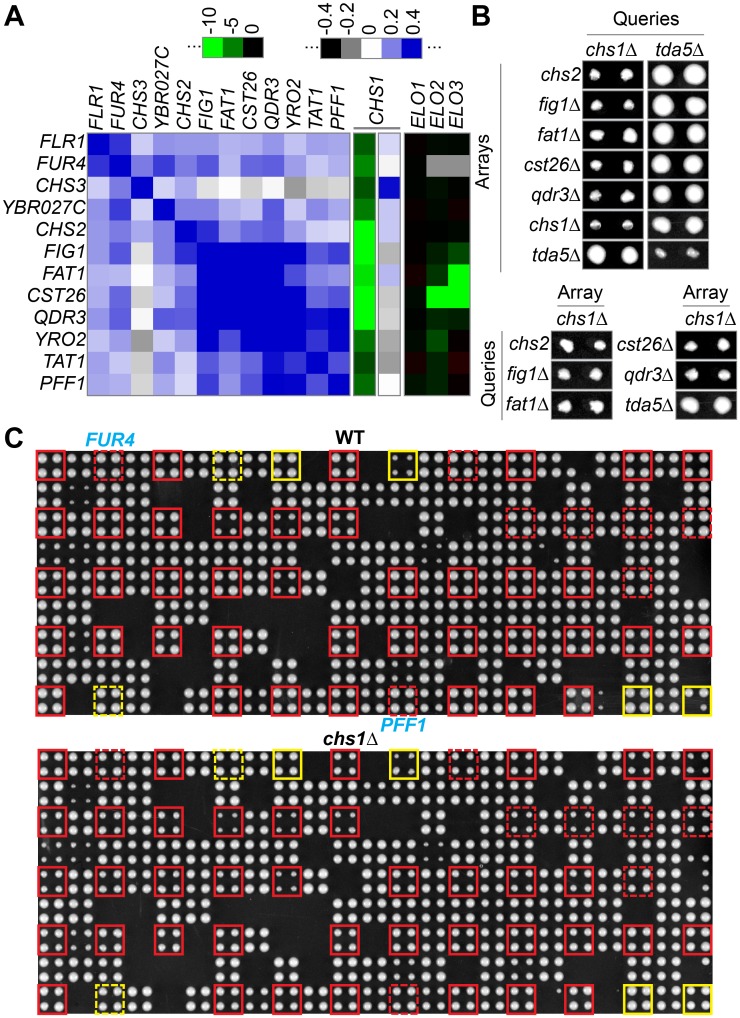
Fig 11. Chs1Δ-interacting cluster on chromosome II.
(A) correlation and selected interaction heat maps of a series of linked genes on the right arm of Chr. II, deletion of which causes significant negative interactions with chs1Δ. Genes are in the same order as they are situated along the chromosome. (B) colonies present on MSP-E-MAP plates after the last selection of double mutants combining deletions in genes indicated on top of column and indicated to the left. As indicated, double mutant colonies are from crosses with chs1Δ used as query or being on an array. Tda5Δ was added as a neutral control, having an S score of 0.07 with chs1Δ. (C) Shows plates from quadruplicate crosses of either a WT query (upper image) or chs1Δ query strain (lower image) with an array plate containing many genes from different chromosomes including all the genes from YBR020W to YBR078W on the right arm of Chr. II. All genes in this chromosomal region are boxed, in red if there is a size difference visible to the naked eye between the WT and chs1Δ plate, in yellow if there isn't. Boxes are dotted for MSP genes that are part of the E-MAP set and are shown in panel A.

