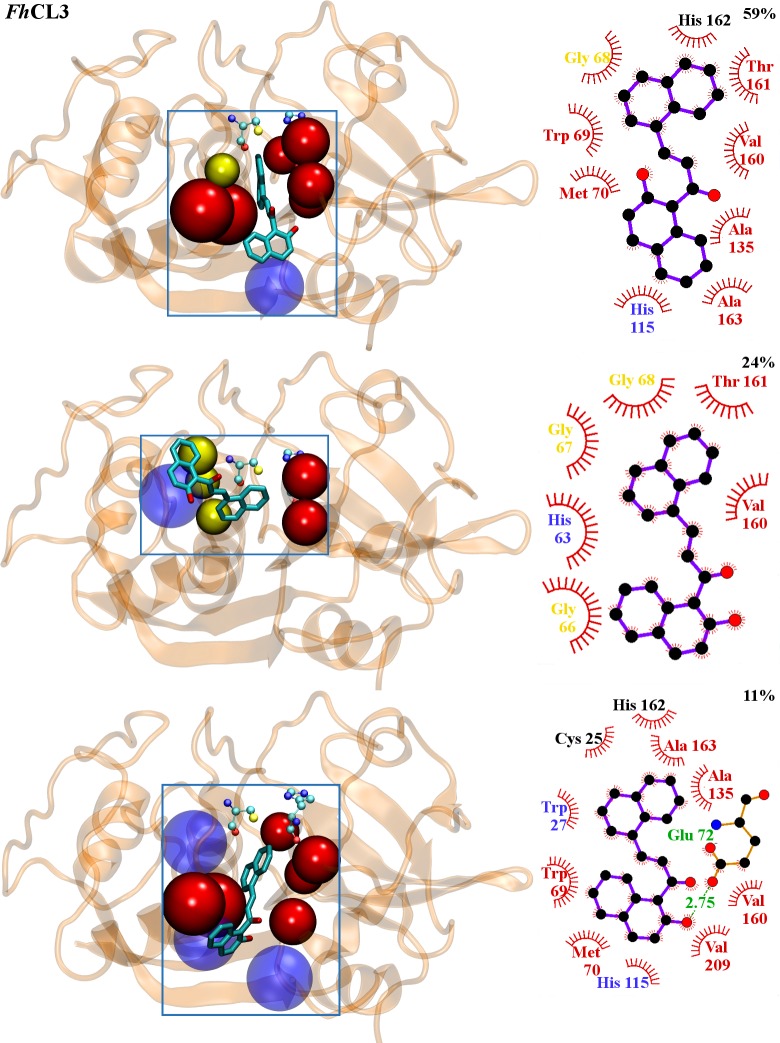
Fig 5. FhCL3-C34 interactions from MD simulations.
Structure of the three most populated clusters for FhCL3. Left panels: C34 structure is represented in balls and sticks. Residues belonging to sub-sites involved on complex formation are represented in beads and colored in red (S2) and yellow (S3). Residues outside the active site pockets involved on complex formation are translucent (light blue). Catalytic dyad is depicted by VDW. Right panels: 2D diagram of interactions between C34 and FhCL3 for each cluster generated using LigPlot+. C34 is shown in violet. Protein residues involved in non-polar contacts are represented as red semicircles with radiating spokes and their names colored according to left panels. A hydrogen bond (green dashed line) is shown together with its distance value (green).

