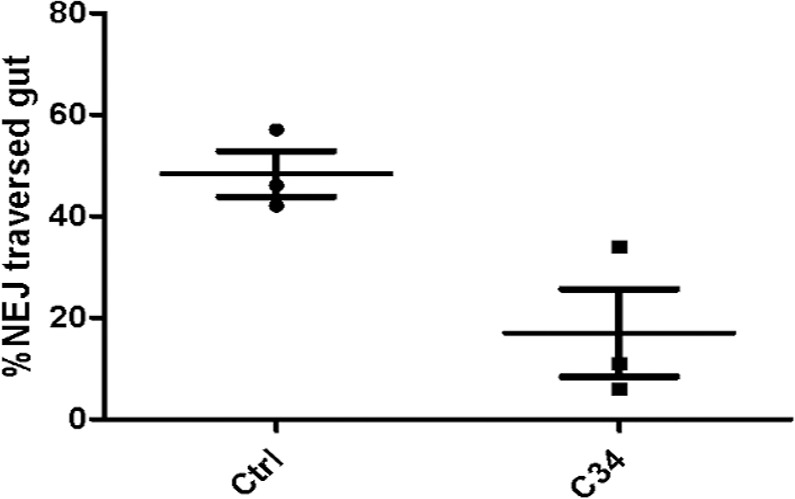
Fig 8. NEJ gut penetration assay.

Scattered plot showing the percentage of NEJ that traverse the gut wall within 3 h in control (circles) and C34 treated groups (squares). Horizontal lines and bars represent means ± SD percent gut penetration, respectively.
