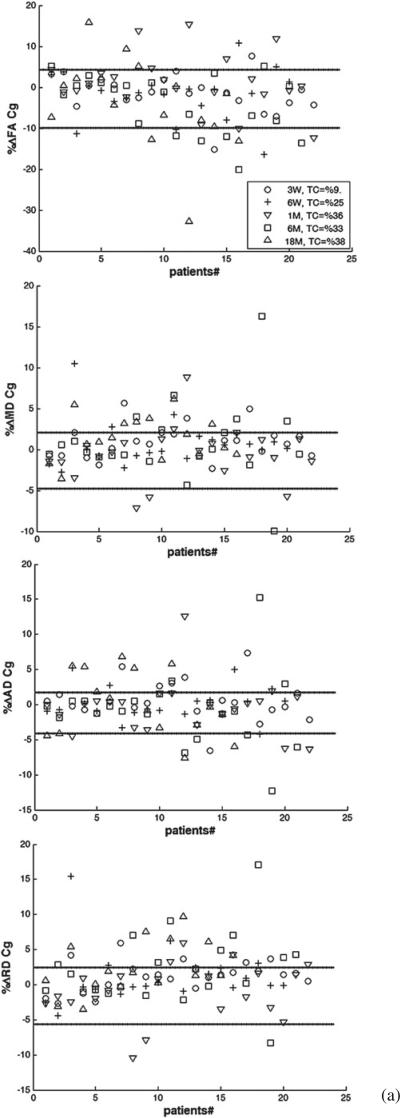
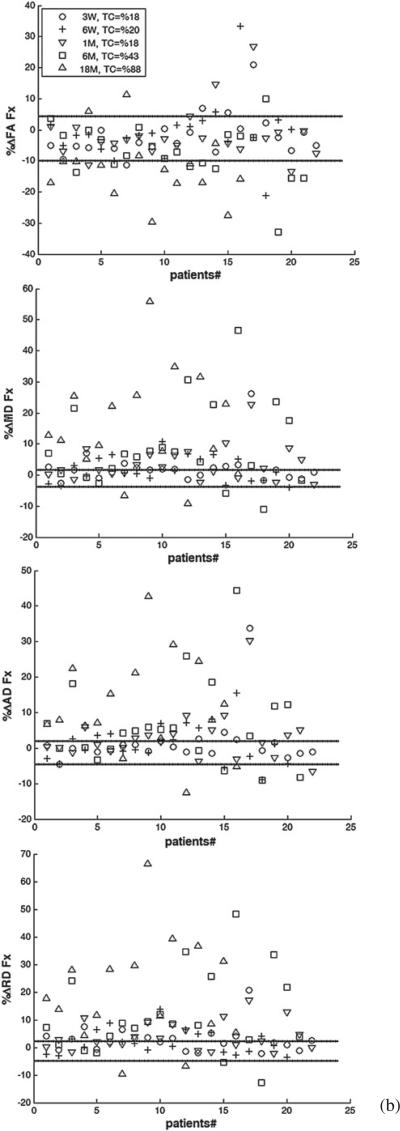
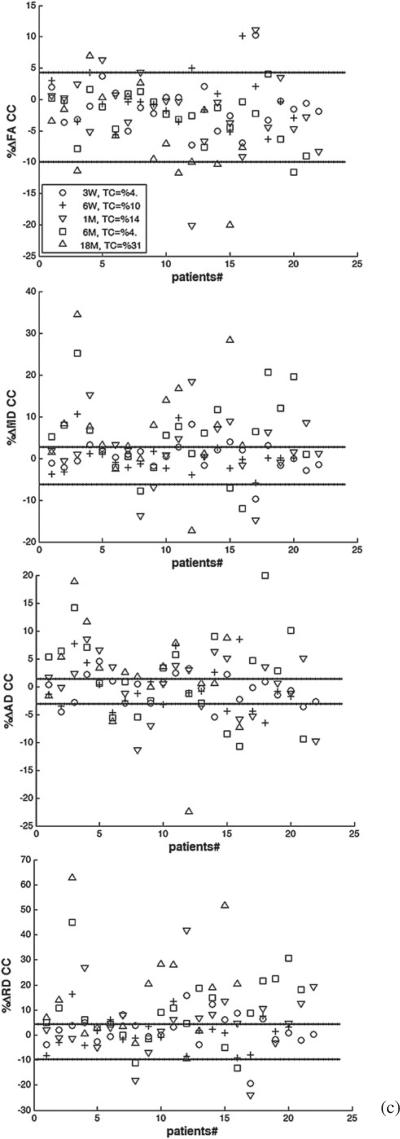
Figure 4.
The individual percentage changes in FA, MD, AD, and RD in the cingulum (a), the fornix (b), and the corpus callosum (c) in the patients who underwent PBRT from pre-RT to week 3 during RT (3 W, circle), end of RT (6 W, plus), 1 month (1 M, downward-pointing triangle), 6 months (6 M, square) and 18 months (18 M, upward-pointing triangle) after RT. TC indicates the percentage of the patients who had changes beyond the uncertainty. The lines show the estimated –RCU and RCL (minus upper limit and lower limit of RC), respectively. If a diffusion index percentage change is larger than RCL or smaller than –RCU, we consider it a true change.


