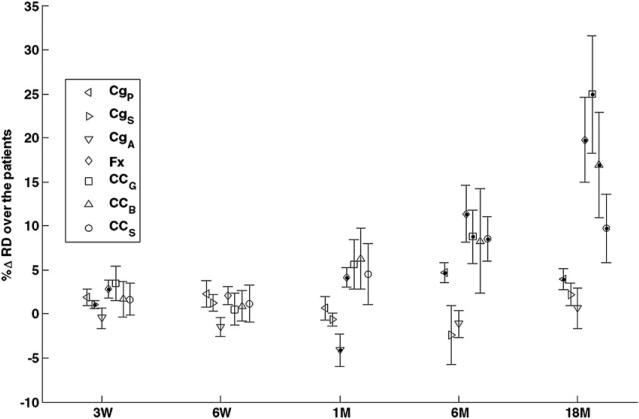
Figure 5.
The means and standard errors of the percentage changes in RD of the cingulum sub-regions of posterior (CgP, left-pointing triangles), superior (CgS, right – pointing triangles), and anterior (CgA, downward-pointing triangles), the fornix (Fx, diamonds), and the corpus callosum sub-regions of genu (CCG, s, squares), body (CCB, upward-pointing triangles), and splenium (CCS, circles) in the patients who underwent PBRT from pre-RT to week 3 during RT, end of RT, 1 month, 6 months and 18 months after RT. The dots inside symbols indicate significant changes.

