
Figure 4.
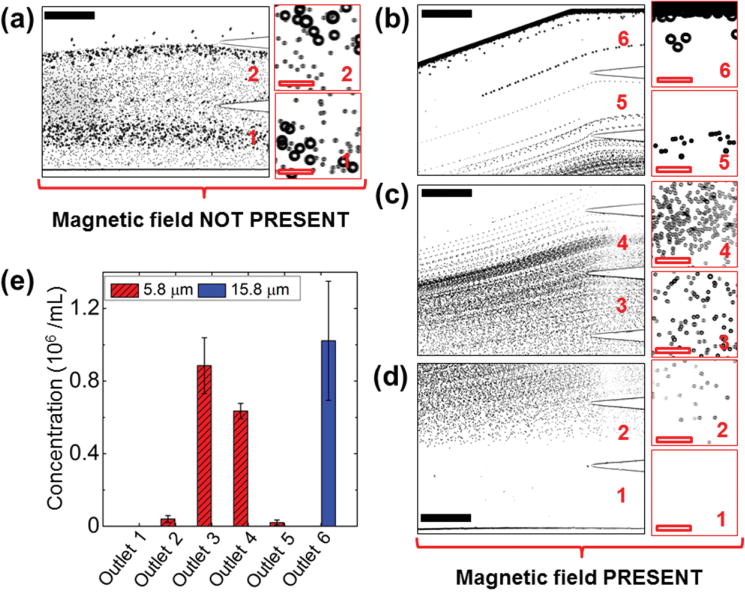
Device performance of microparticle calibration. a) In absence of a magnetic field, microparticle mixtures exited the channel through Outlets 1 and 2. Insets are zoom-in views of the outlets. b–d) When magnetic fields were applied, 15.8 μm microparticles exited through Outlet 6, while 5.8 μm microparticles exited through Outlets 2–5 (labeled in red color number). e) Type distribution of microparticles at each outlet. 15.8 μm microparticles were exclusively enriched into Outlet 6, while 5.8 μm microparticles were separated into Outlets 2–5. Error bars are from four repeats of experiments. Black solid scale bars represent 400 μm, red hollow scale bars represent 50 μm.