
Figure 7.
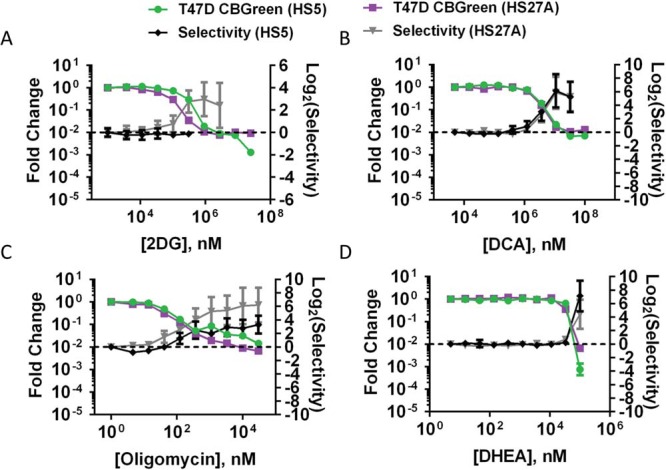
Metabolic inhibition selectively eliminates T47D cancer cells. Graphs show mean values ± SEM (N = 7 per condition) of fold-change in cancer cell bioluminescence and drug selectivity in spheroids composed of T47D cancer cells and HS-5 or HS-27A stromal cells treated with 2-deoxy-glucose (A), dichloroacetate (B), oligomycin (C), or DHEA (D).