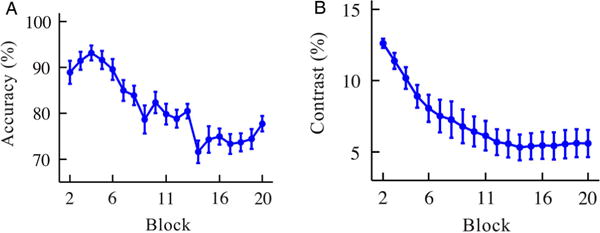
Figure 2.

(A) Mean accuracy as a function of block number. (B) Contrast levels at each block, averaged over the 37 participants of Experiment 1. The ordinate displays the proportion contrast, above or below the background. The first block was a practice block and was not analysed. Error bars in both figures represent between-subjects standard error of the mean (SEM).
