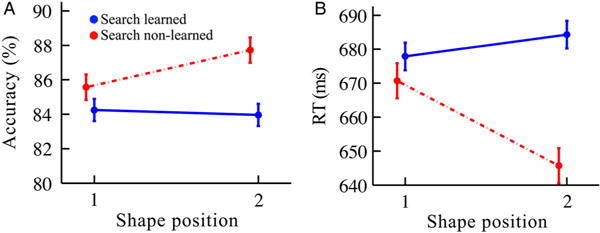
Figure 5.

Detection task results in Experiment 1 split by the search task, in terms of (A) accuracy and (B) RT. “Search learned” were pairs that demonstrated learning in the subsequent search task (solid blue lines). “Search non-learned” were pairs that did not demonstrate learning in the subsequent search task (dashed red lines). Error bars reflect ±1 within-subjects SEM. N = 37. (N of pairs in blue curves = 106; N of pairs in red curves = 79.)
