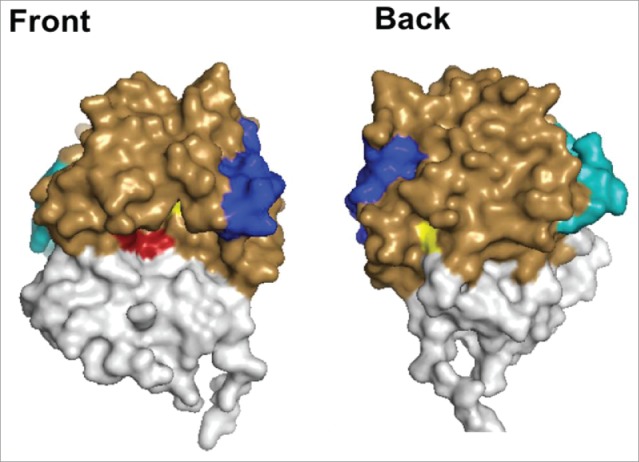
Figure 1.

Depiction of the Structures of RiVax and RVEc. A front and back surface projection of RiVax (PDB: 3SRP) with the color coded with attenuating point mutations (yellow), active site (red), epitope cluster I (blue), and epitope cluster II (cyan). For comparison purposes, the regions of RiVax that have been omitted in RVEc (residues 34–43 and 199–267) are colored in white.
