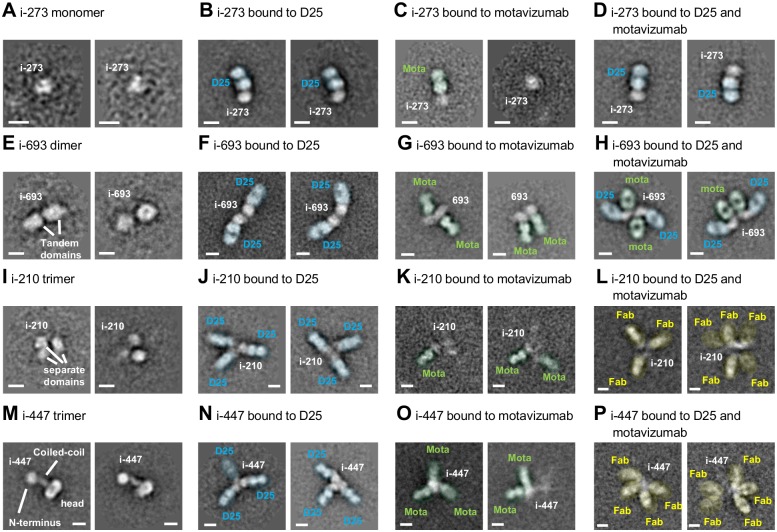
Fig 3. Negative-stain electron microscopy of head-only immunogens.
Panels (A-P) show typical 2D averaged classes of i-273,i-693, i-210 and i-447 alone (A, E, I and M), in complex with D25 (in blue; B, F, J and N), in complex with motavizumab (in green; C, G, K and O) and in complex with both D25 and motavizumab (in blue, green; D, H, L and P). Yellow indicates Fabs of ambiguous identity. Two separate averages are shown for each panel. White scale bars are 50 Å long.

