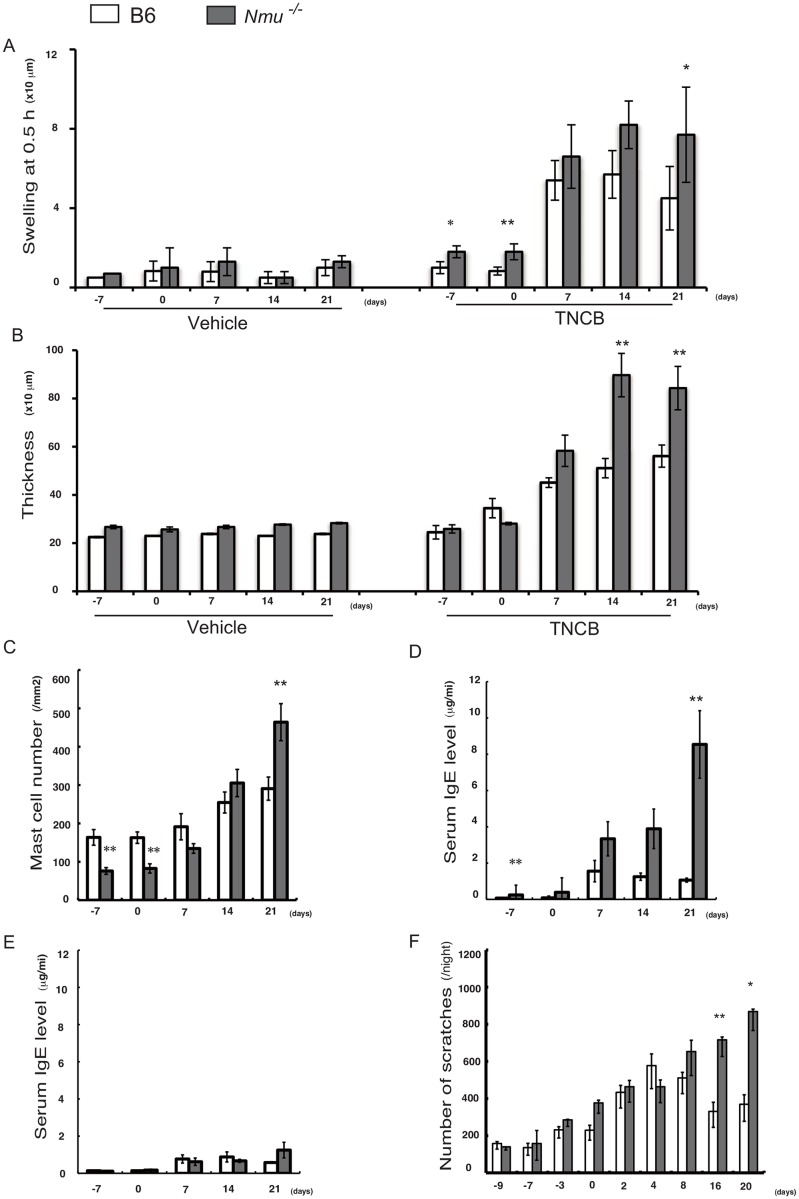
Fig 2. Differences in the responses of mice after repeated hapten application to the ear or footpad.
(A) A hapten-specific ITH reaction is indicated by rapid ear swelling 0.5 h after each elicitation (n = 10). (B) Ear thickness (n = 10). (C) Number of mast cells in the ear (n = 5). (D) Serum IgE levels of mice after repeated hapten application to the ear (n = 10). (E) Serum IgE levels of mice after repeated hapten application to the footpad (n = 10). (F) Total number of scratching episodes from 7:00 PM–7:00 AM (n = 10). (A–F) Data are expressed as the mean ± SEM. *P < 0.05, ** P < 0.01.

