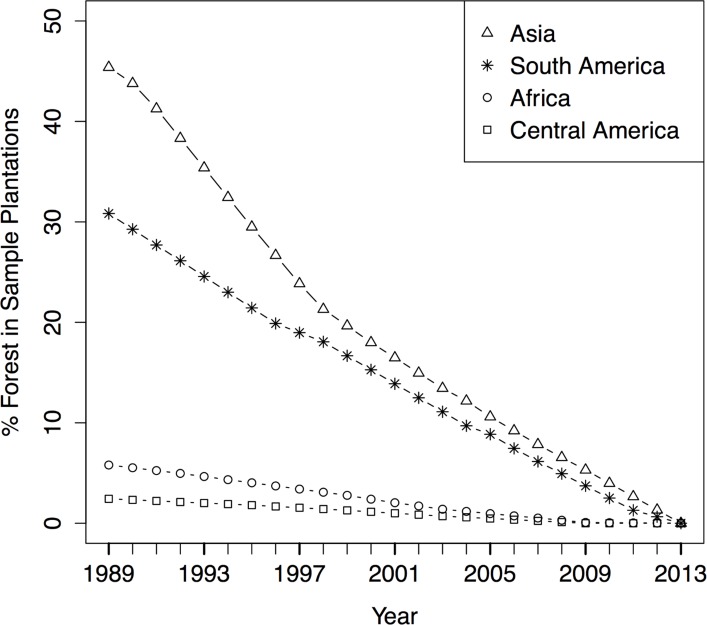
Fig 3. Annual percent change in forest areas within oil palm plantations by region.
Values are an average of the proportion of sampled 2013 oil palm plantation area classified as forest each year in five countries within each region, weighted by each country’s 2013 FAO-reported oil palm planted area.

