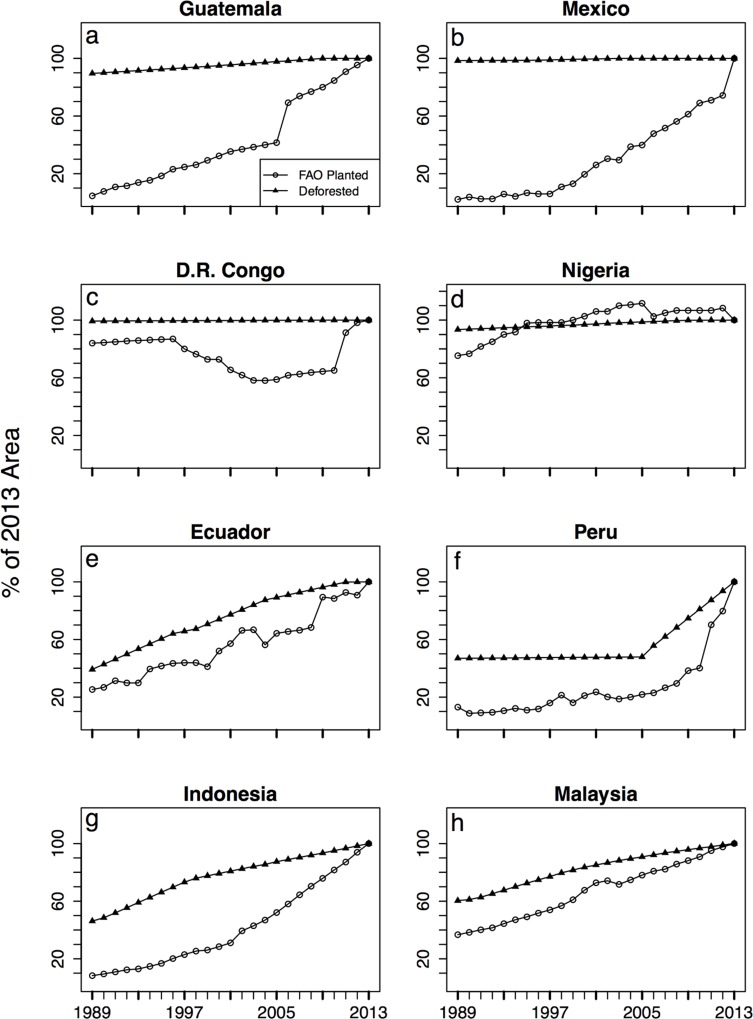
Fig 4. Trends of deforestation and oil palm planted area.
Trends of deforestation inside sampled oil palm plantations (solid triangle) and total FAO oil palm planted area for eight countries (open circle). Both trends are relative to 2013 values, thus both reach 100% in 2013. Countries represented are either representative of regional trends or distinct from regional trends for sample countries. (a, b) Mesoamerica, (c, d) Africa, (e, f) South America, (g, h) Southeast Asia.

