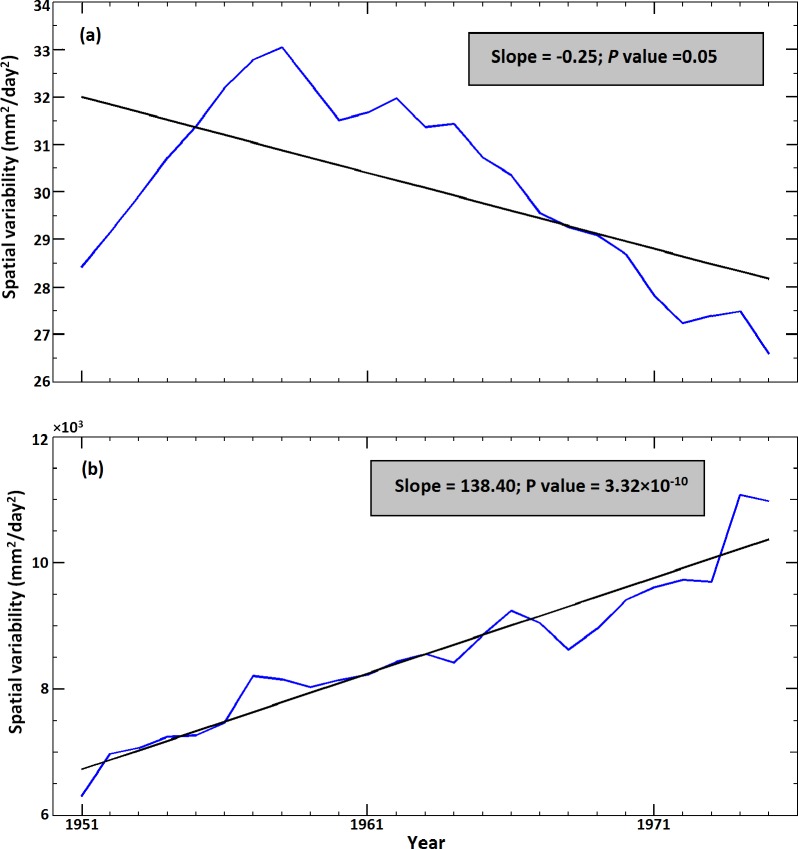
Fig 1. Trends in the spatial variability of the ISMR from 1951 to 2004 over the Indian region.
(a) Trend in the spatial variability of the mean monsoonal rainfall over the Indian region with a 30-year overlapping moving window. The blue line indicates the spatial variability of the mean rainfall, whereas the black solid line shows the fitted trend (linear) line. The mentioned trend value was computed with the modified Mann-Kendall approach. (b) Trend in the spatial variability of the extreme rainfall (corresponding to a 50-year return period) with the blue and black lines representing analyses similar to those shown in panel (a). The trends in both panels are significant at the 5% significance level.

