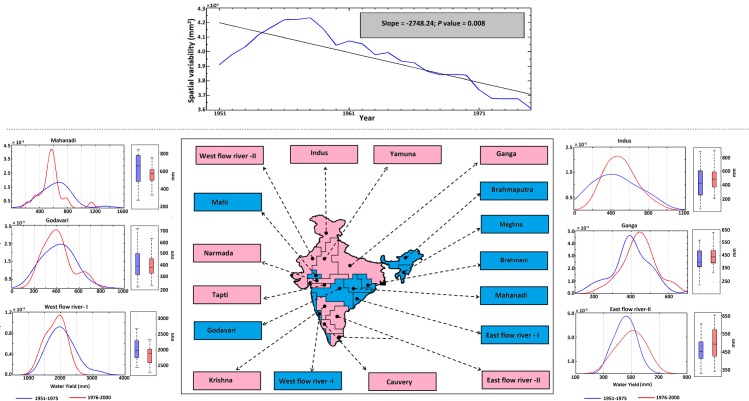
Fig 2. The trend in the water yield over the entire Indian region and the changing pattern of the same for selected surplus and deficit river basins.
The panel in the upper part (separated by a dotted line) indicates the spatial variability of the water yield (blue) for all basins combined over the Indian region from 1951 to 2004 with a 30-year overlapping moving window. The black solid line shows the fitted trend (linear). The modified Mann-Kendall trend was observed to be significant at the 5% level. The map in the lower part of the figure depicts the surplus (blue) and deficit (magenta) water basins of India. The names of the rivers belonging to surplus/deficit basins are indicated in the respective boxes. The panels around the map are exemplary graphs showing the changes in water yield during the recent period (1976–2000) compared with the past (1951–1975) for six major rivers belonging to surplus (Mahanadi, Godavari and West flow river I) and deficit (Indus, Ganga and East flow river–II) water basins. The blue and red curves represent the PDFs of the water yield for the past and recent periods, respectively. The shift of the red curve in the positive direction with respect to the blue curve indicates the increase in water yield and vice versa. The water yields are also presented in terms of a box-whisker plot, with red and blue boxes representing the recent and past periods, respectively.

