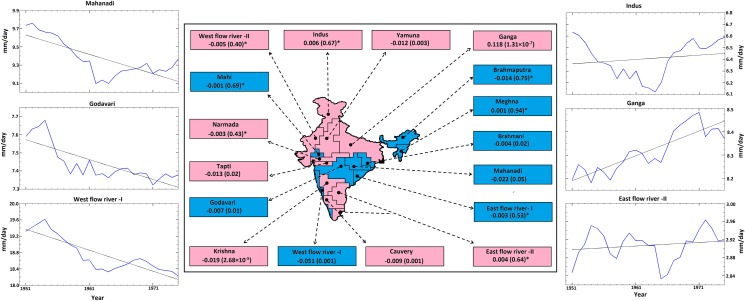
Fig 3. The trend in precipitation for selected rivers in surplus and deficit water basins.
The map depicts the surplus (blue) and deficit (magenta) water basins of India. The names of rivers belonging to surplus/deficit basins are indicated in the respective boxes. The values in the boxes are the magnitude (p value) of the trend estimated by the modified Mann-Kendall approach, where a star (*) indicates that the trend is insignificant at the 5% level. The panels around the map are exemplary graphs showing the trends for four major rivers belonging to surplus (Mahanadi, Godavari and West flow river -I) and deficit (Indus, Ganga and East flow river II) water basins. The black solid line shows the fitted trend (linear). The trend is observed to be significant at the 5% level for surplus basins (decreasing); however, for deficit basins, it is significant only for the Ganga basin (increasing).

