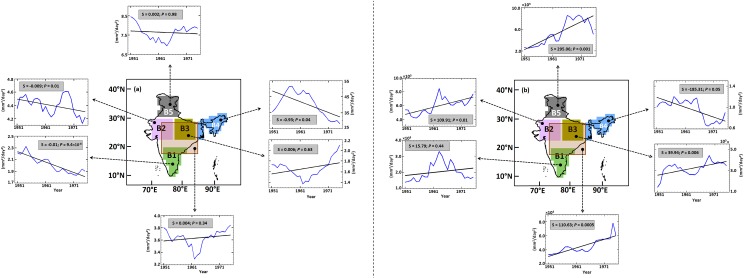
Fig 5. Trends in the spatial variability of the ISMR from 1951 to 2004 over the five different regions with a 30-year overlapping moving window.
The graphs associated with map (a) indicated by the dotted arrow demonstrate the trend in the spatial variability of the mean monsoonal rainfall (blue), with the black line indicating the fitted trend (linear) line. The mentioned trend values were computed with the Modified Mann-Kendall approach. Trends are significant only for regions B1, B2 and B4. The graphs associated with map (b) are similar to those of (a) except for the extreme rainfall corresponding to a 50-year return period; specifically, the trend is significant for all regions except region B1. The transparent box in both maps (a and b) indicates the central Indian region (74.5°E to 86.5°E and 16.5°N to 26.5°N) as adopted by G06, wherein the trend in the spatial variability of the mean and extreme monsoonal rainfall is insignificant and significant, respectively. Please note that the scales of the ordinate are different for all graphs associated with both maps. Refer to the S1 Text for more details about the selection of the regions (B1-B5).

