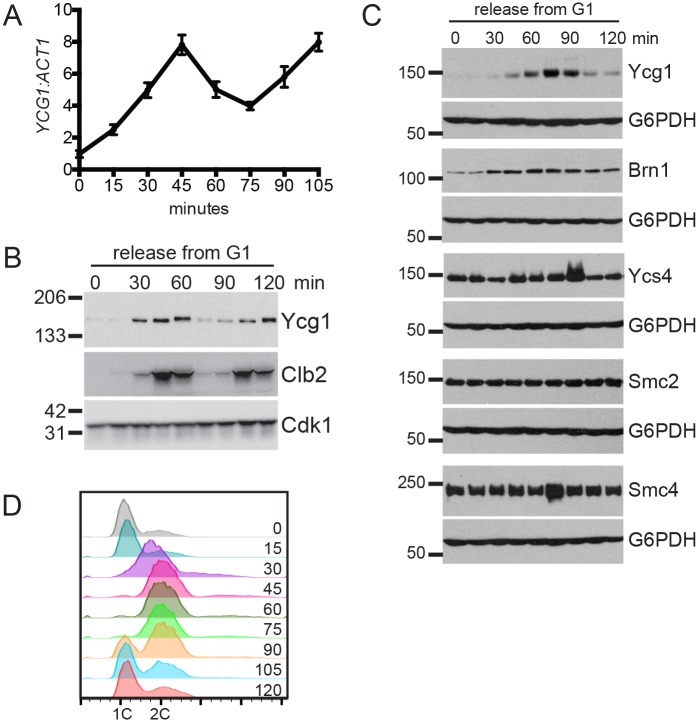
Fig 1. Ycg1 expression is cell cycle-regulated.
(A) YCG1 mRNA levels following release from G1 arrest. Wild-type cells (YBL320) were arrested in G1 with alpha-factor for 2 hours, released into the cell cycle, and gene expression changes were analyzed by RT-qPCR. YCG1 levels are shown relative to ACT1. Time course samples were previously analyzed by DNA microarray in [40]. (B) Wild-type cells expressing Ycg1-GFP (YCG1-GFP) were arrested in G1 with alpha-factor for 3 hours then released into fresh medium, as in (A). Western blot samples were collected every 15 minutes. Clb2 is shown as a marker of mitosis and Cdk1 is shown as a loading control. (C) Wild-type strains expressing the individual condensin subunits tagged with a 3HA tag (YTD33, YTD82, YTD83, YTD84, YTD80) were arrested in G1 with alpha-factor for 3 hours, released into the cell cycle, and samples taken for Western blot and flow cytometry every 15 minutes. Alpha-factor was added back after 45 minutes to arrest cells in the subsequent G1 phase. (D) Representative plot showing DNA content following release from G1 arrest in (C), data is from the YTD33 time course. All other strains showed nearly identical plots. Note that the strains in used in parts A and B are in a different strain background than those used in parts C and D (S288C compared to W303), and the timing of cell cycle-progression differs slightly.

