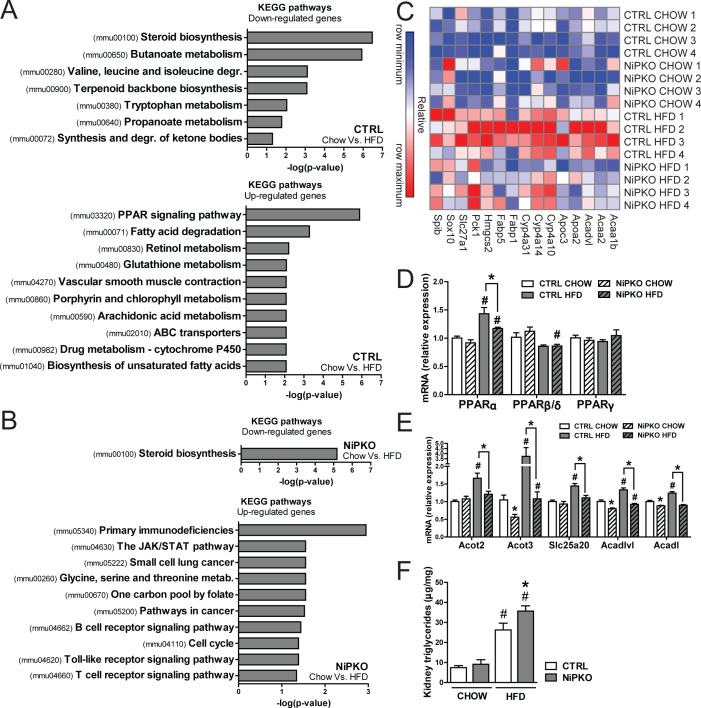
Fig 7. NiPKO mice develop exacerbated renal steatosis with high fat diet-feeding.
KEGG pathway enrichment analysis performed on gene expression array data from kidney from either CHOW or HFD-fed control (CTRL) or NiPKO mice. (A-B) Top significant terms for KEGG pathway enrichment analysis of transcripts either down- or up-regulated with HFD-feeding in (A) CTRL or (B) NiPKO mice. (C) Heat map generated using probe set intensities for transcripts associated with the KEGG-categories “PPAR signaling pathway” and “Fatty acid degradation” in figure A, for CHOW- and HFD-fed CTRL or NiPKO mice. Row minimum = -10, row maximum = 10 fold change. (D-E) mRNA levels of indicated genes in kidney normalized to eEF2 mRNA levels, in CHOW or HFD-fed CTRL or NiPKO mice (n = 7–8). (F) Triglycerides in kidney from CHOW- and HFD-fed CTRL or NiPKO mice (n = 6–8). Error bars represent mean ±SEM. Significant differences (p-value <0.05) between genotypes are indicated by an asterisk (*) and between chow- and HFD-fed groups by a number sign (#).

