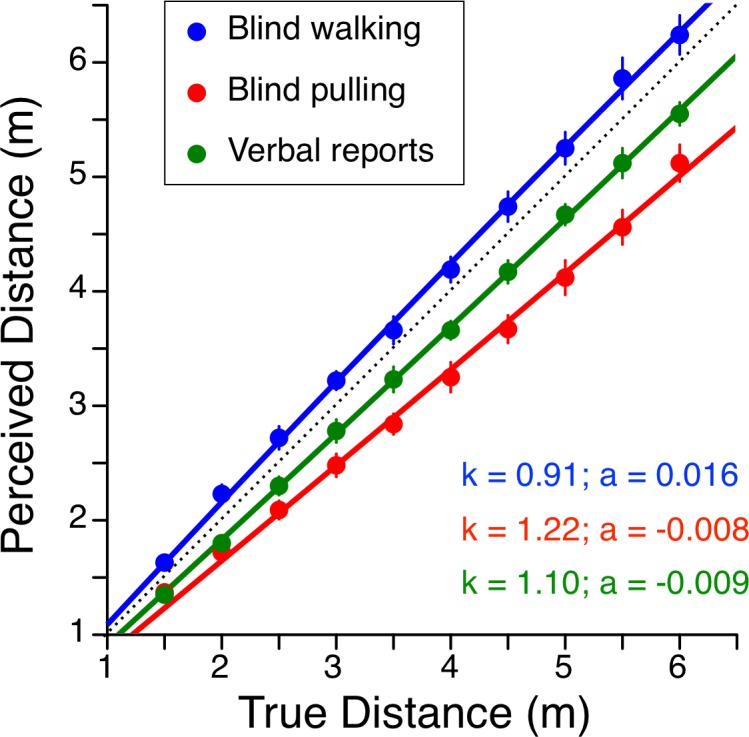
Fig 2. Preflight comparison between the perceived distances estimated using blind walking, blind pulling, and verbal reports for each target distance (true distance).

Mean ± SE of 9 subjects. The continuous lines are the fits by the leaky integration model described in [16]. k is the gain and a is the spatial decay constant; the dashed line indicates veridical performance (k = 1; a = 0). Individual data are reported in S1 Table.
